AI Powered Validation
Deep learning model that validates each upload before allowing to create a report. Thus, reducing irrelevant data and ensuring efficient processing on the management end.


Spothole is a Artificially Intelligent Pothole Detection, Reporting and Management Solution. It is available on the Web and contains a Responsive Suite of Tools for Reporting and Management.
In articles covered by Guardian News & Media, potholes took a deadly toll in 2017, claiming almost 10 lives daily. InShorts reported, potholes killed more people than terrorists reporting 14,926 deaths in road accidents in India. Keeping the roads in good condition, along with keeping the people informed is a task. This has been the main motivation behind developing Spothole.
The idea behind Spothole is to help citizens report their inconveniences in a systematic way, and at the same time help concerned local authorities take actions and manage the same while staying in touch, thus enabling a communication channel between the authorities and the citizens.
Deep learning model that validates each upload before allowing to create a report. Thus, reducing irrelevant data and ensuring efficient processing on the management end.
A reporting system for the citizens where they can capture the scene of an area, which is geocoded and fed to the core AI to create a validated report.
An application for authorities to administer reports using different viewing techniques to manage work orders efficiently for their jurisdictions.
Desktop and mobile compatible citizen and authority applications. Supports a number of features and can be used with any of the popular browsers.
An application for reporting potholes, tracking complaints, communicating with the concerned authorities and also tracking an entire route's status by severity. In other words an app for the people.


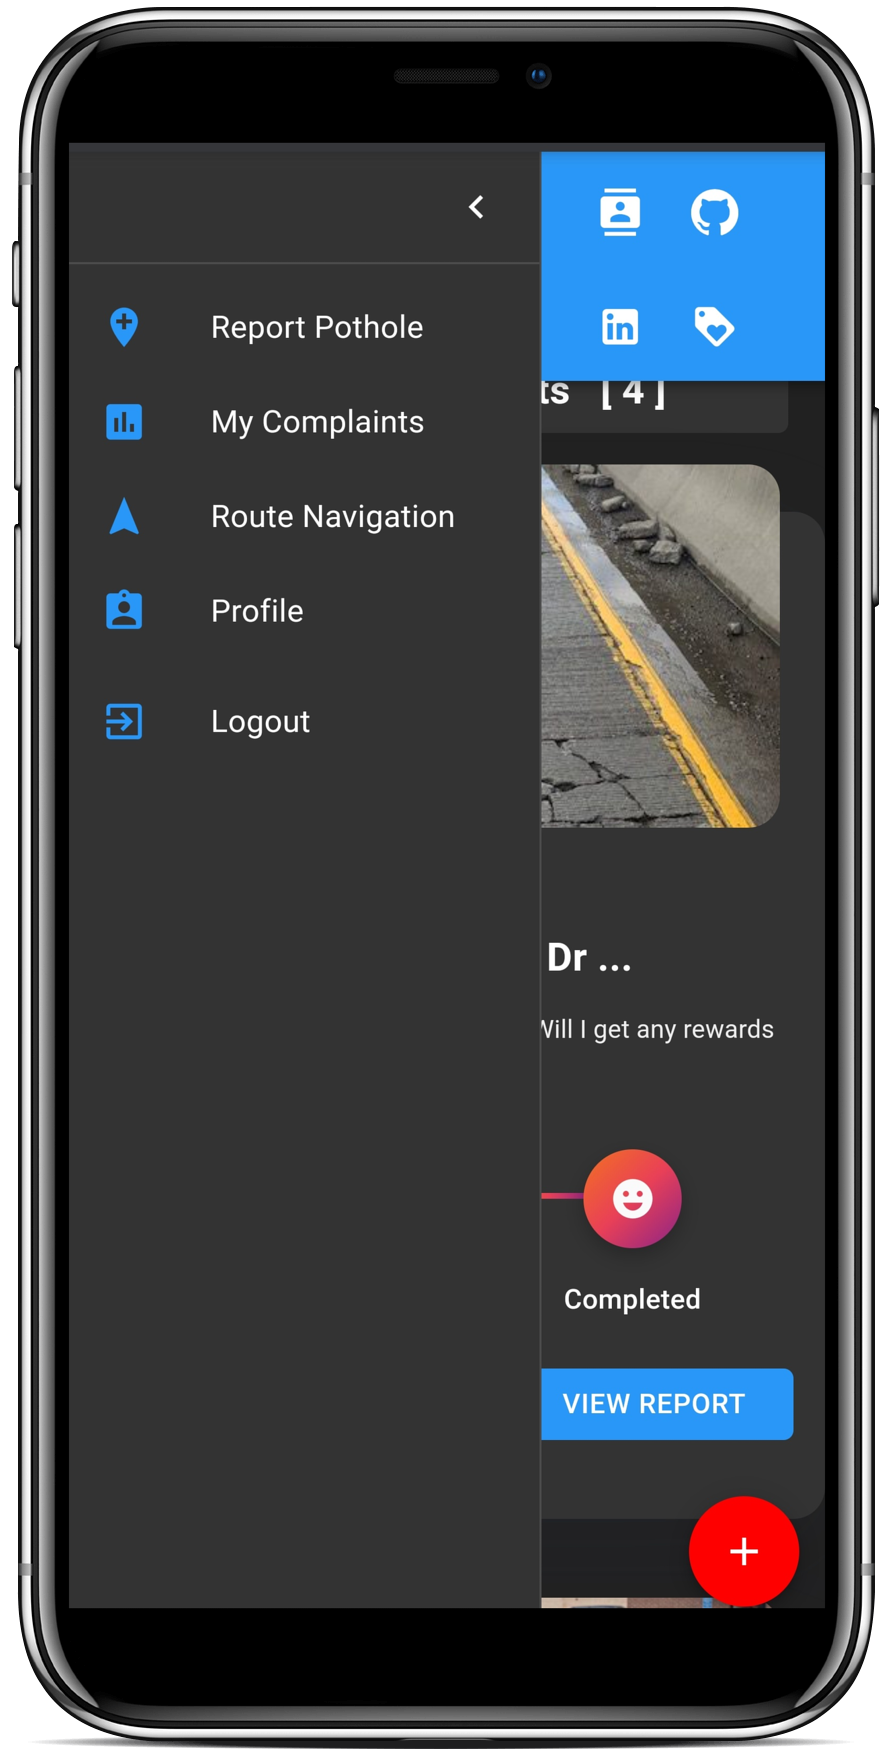
The citizen's application has been divided into four main sections. Here's a detailed description of each of the sections.
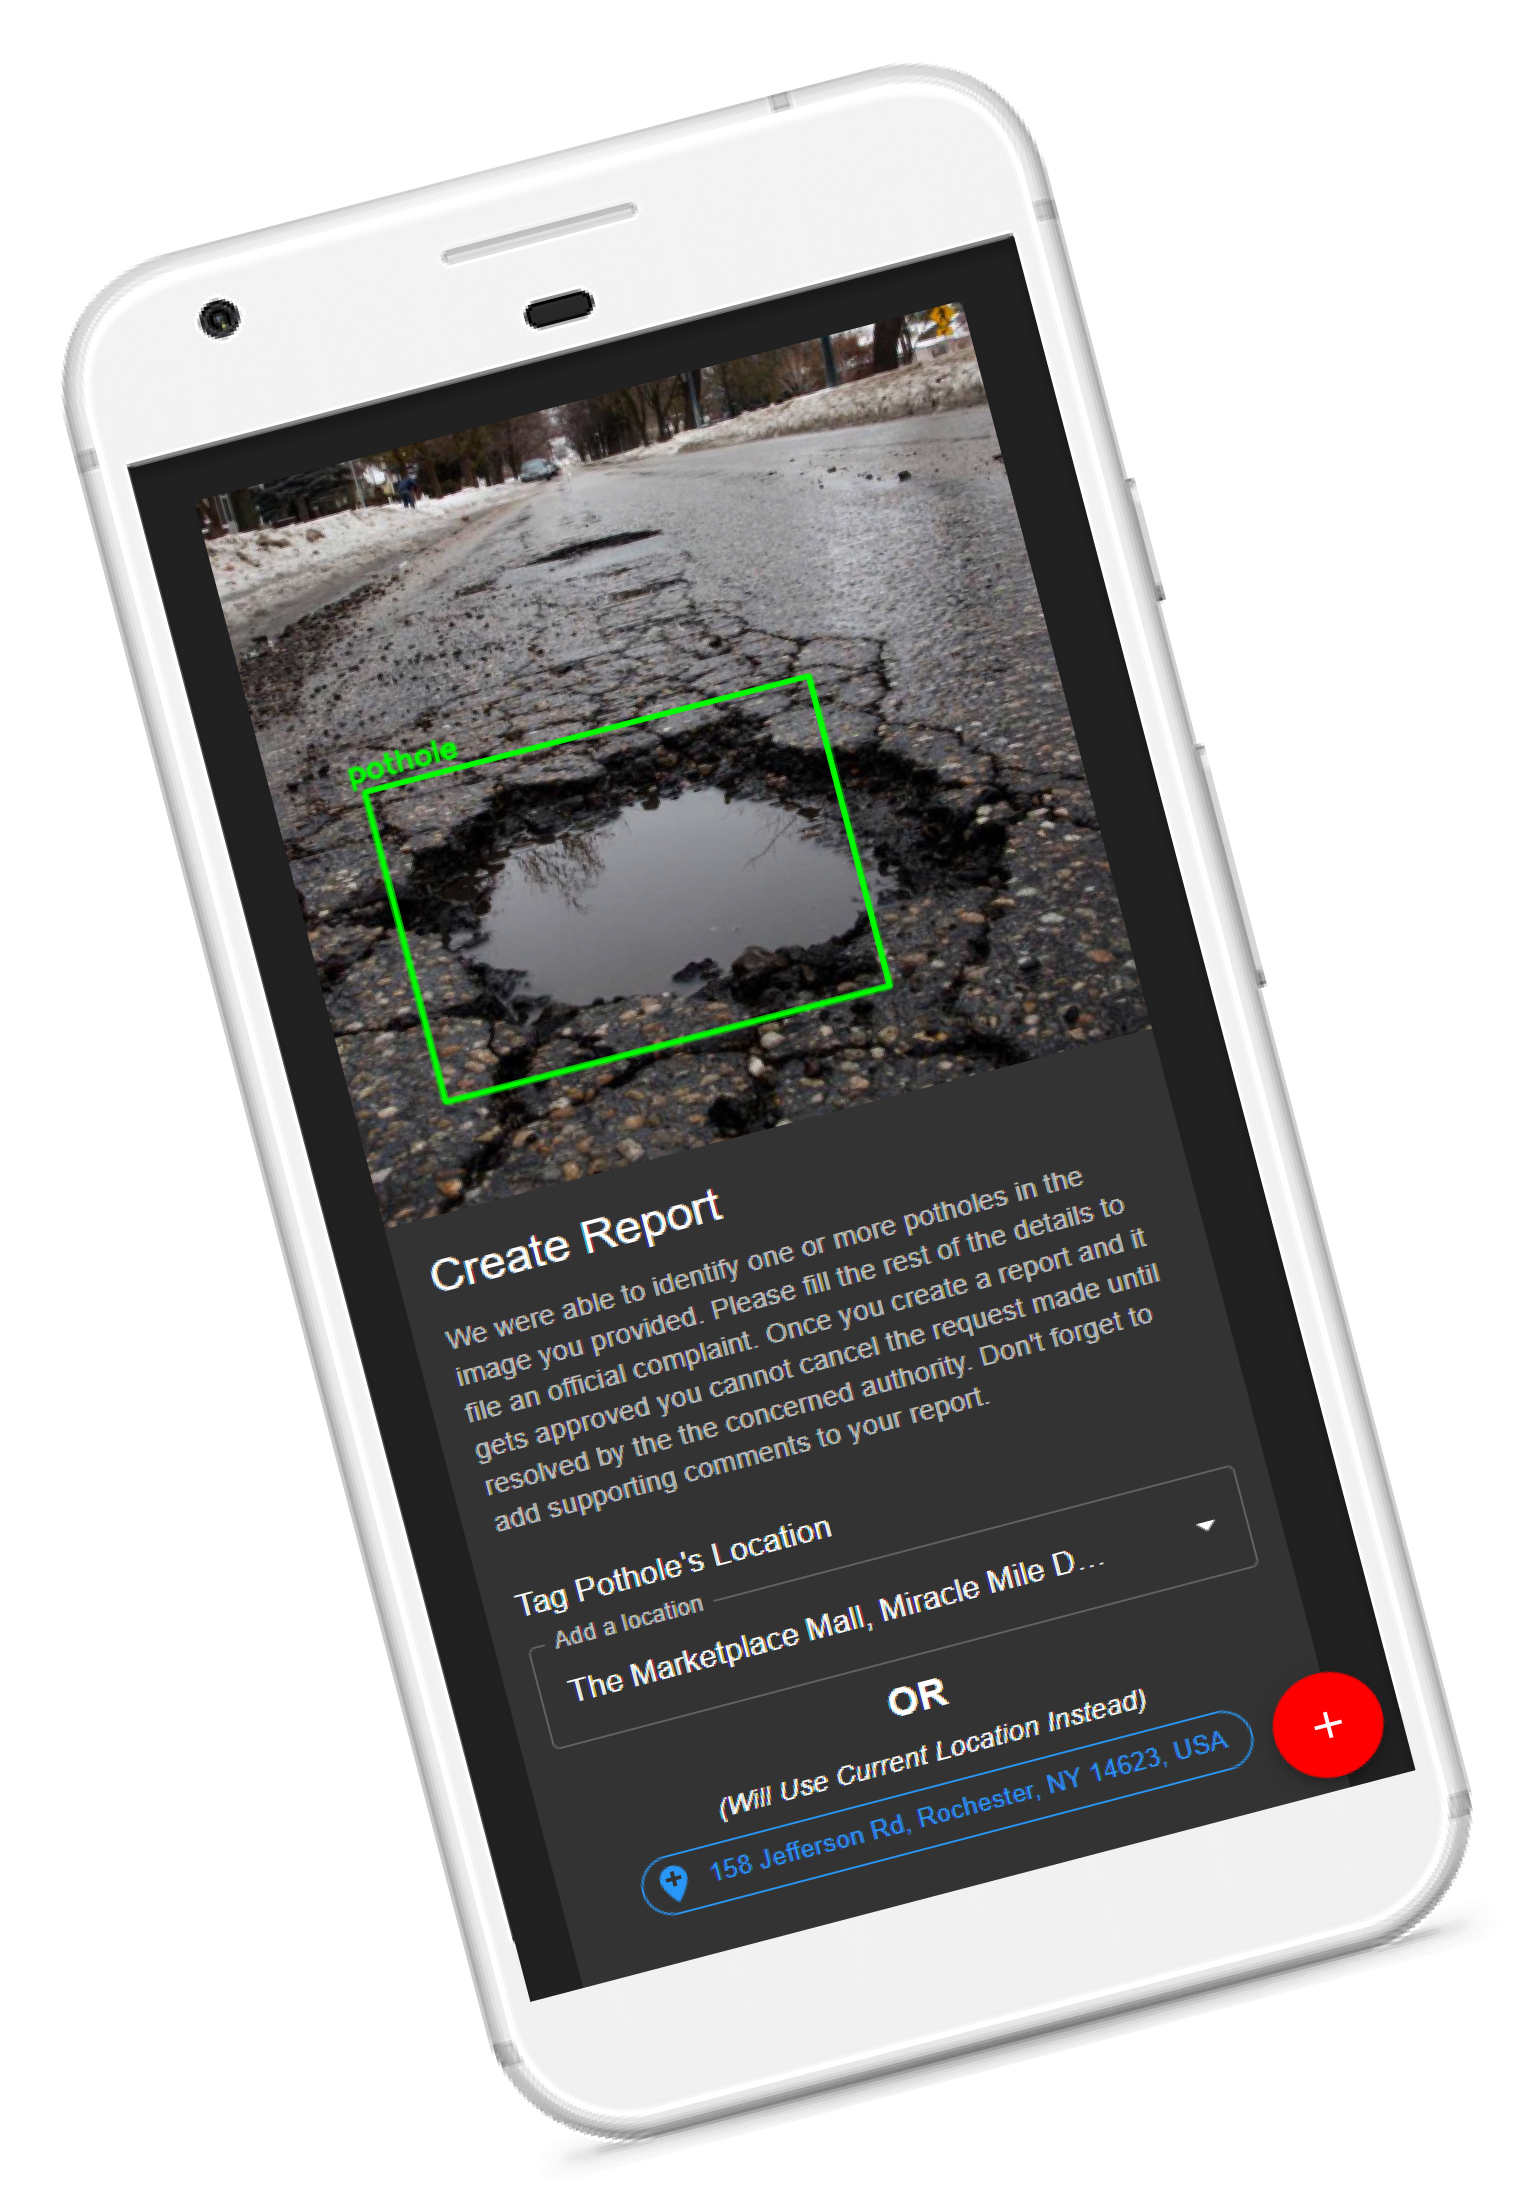
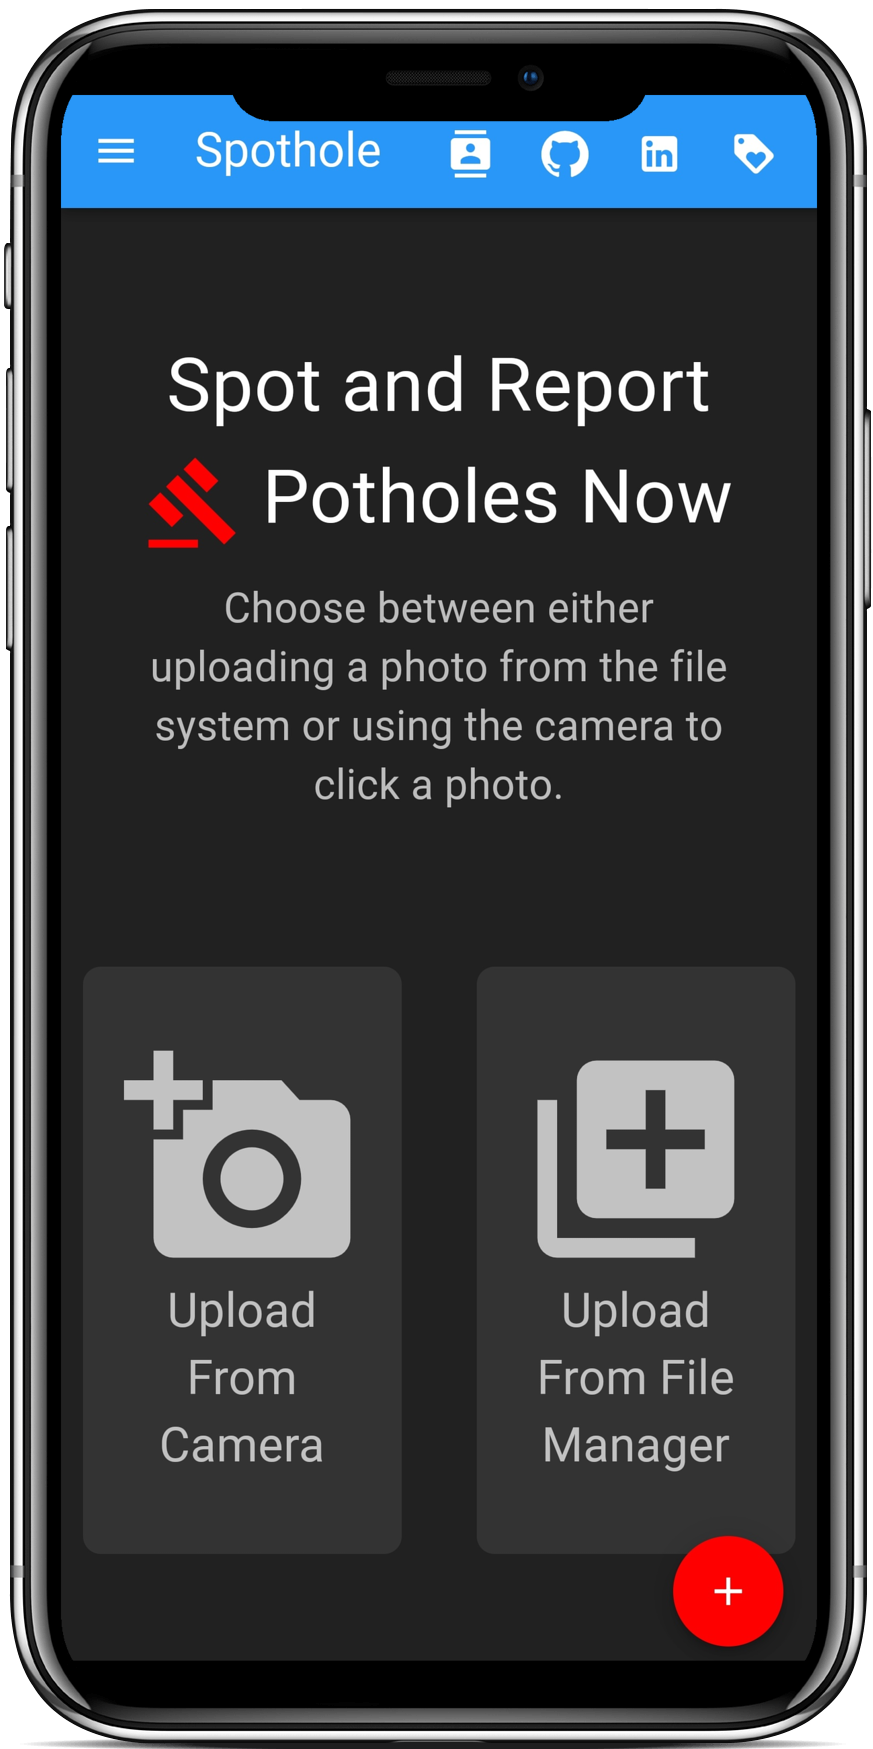
1. Add a new report either by clicking on the floating action button at the bottom right or from the drawer by pressing the hamburger icon in the app bar.
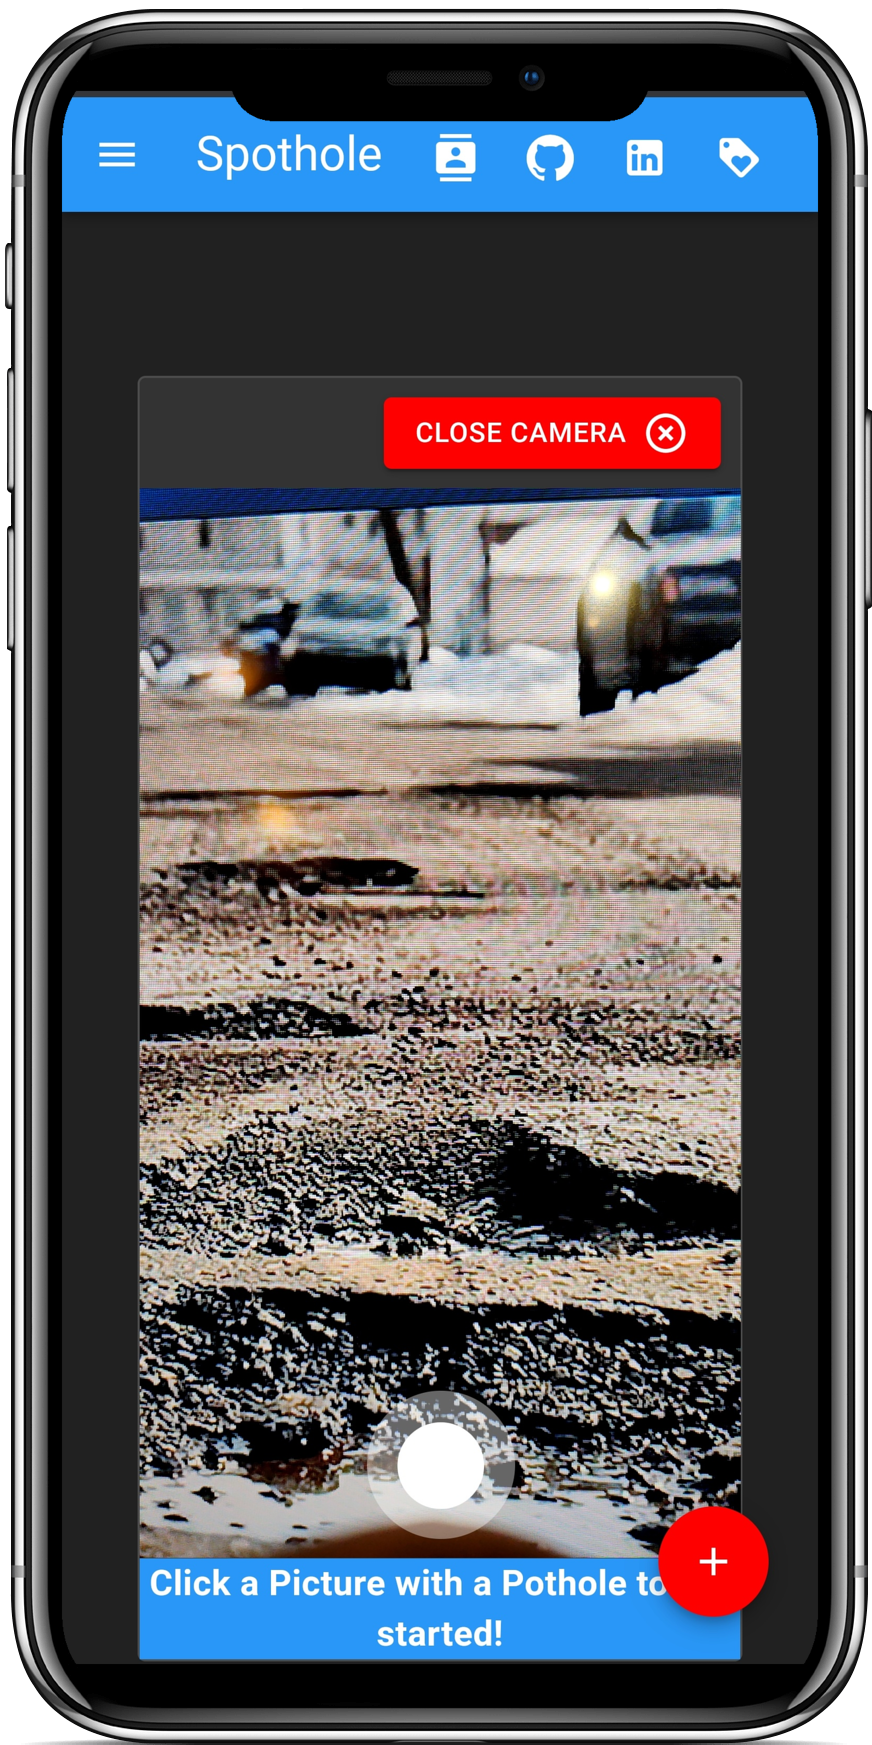
2. Upload an image of a pothole either by browsing through the file system or by clicking a fresh photo using the inbuilt camera.
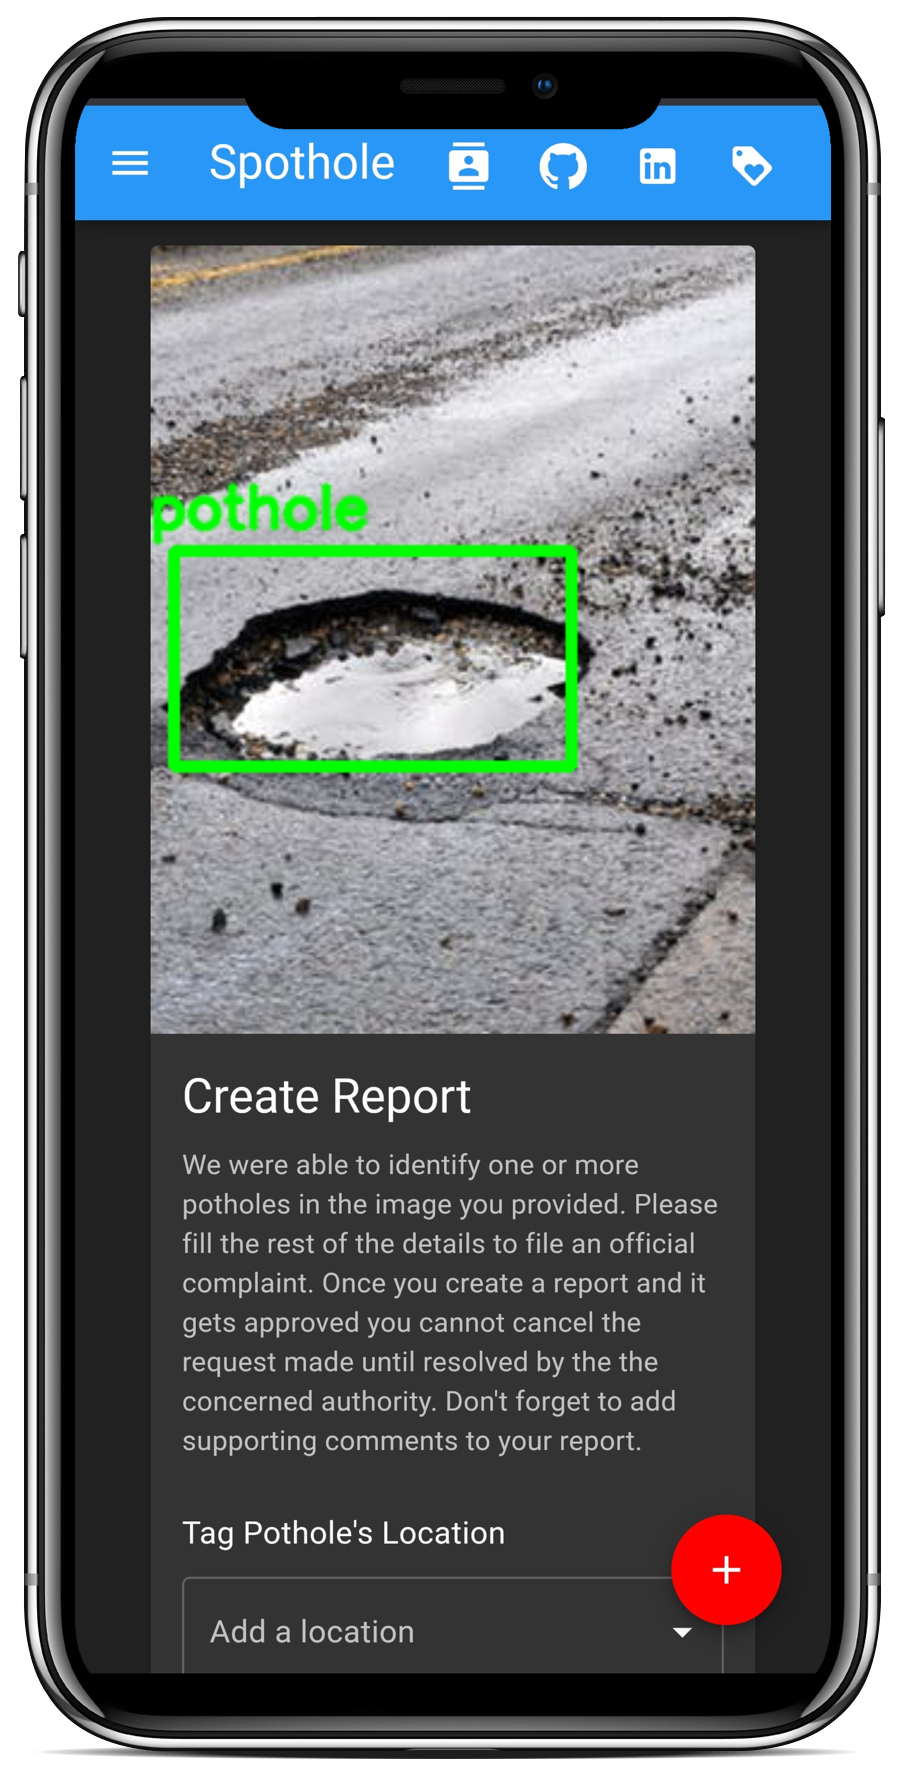
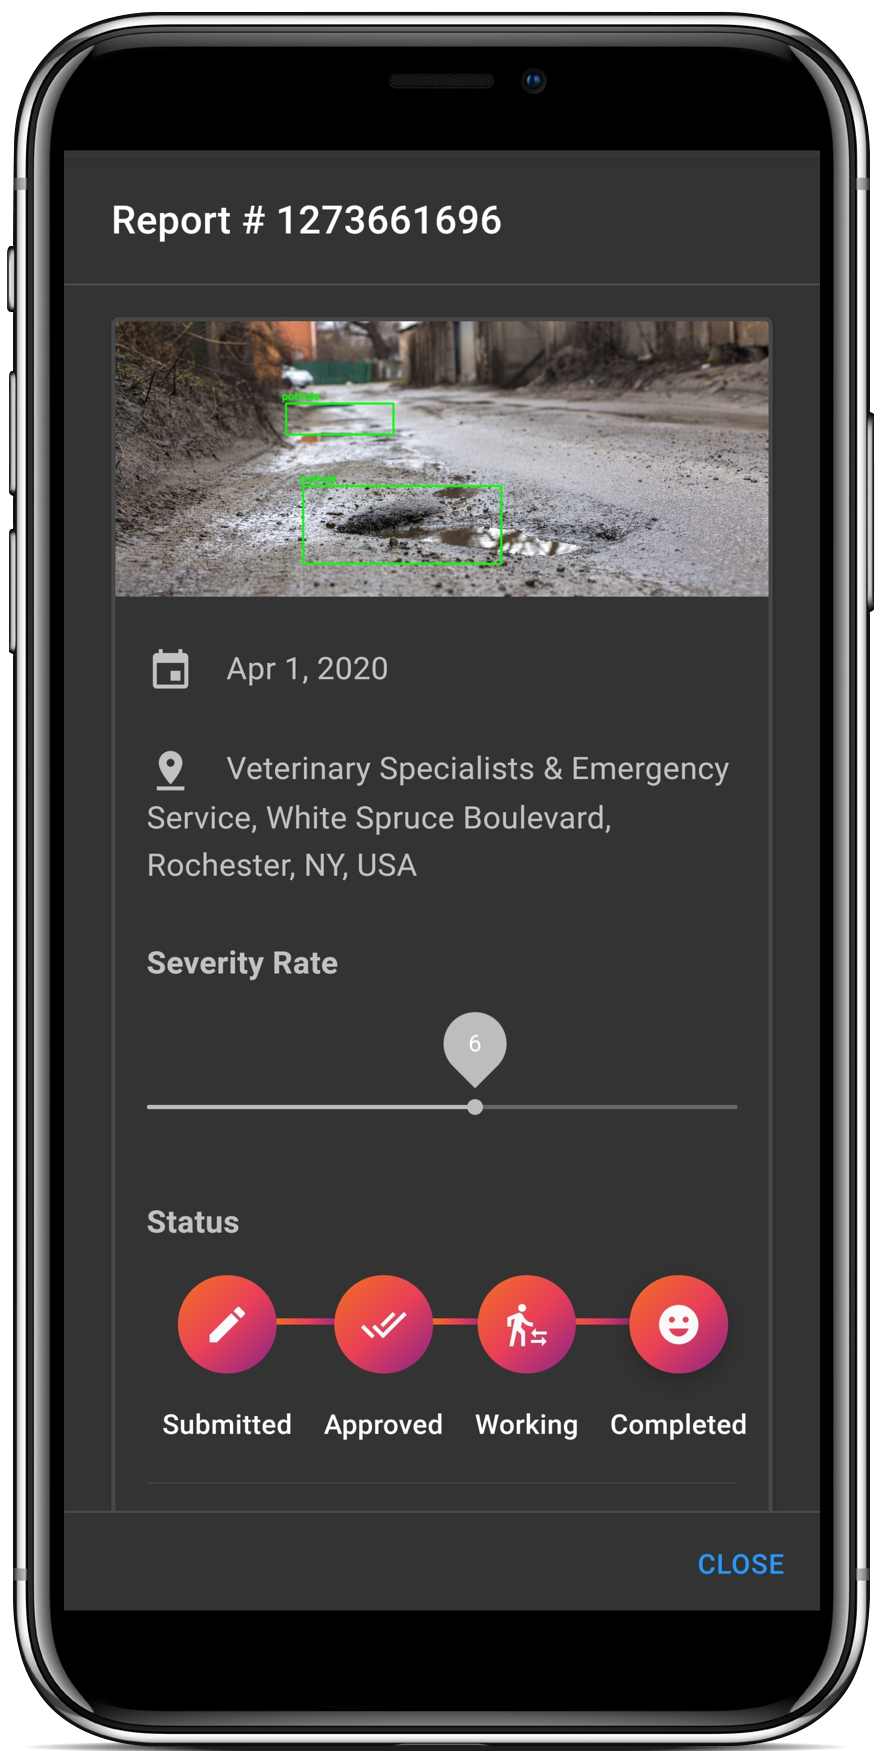
3. Once uploaded the image is validated by the deep learning model to verify if it contains one or more potholes.
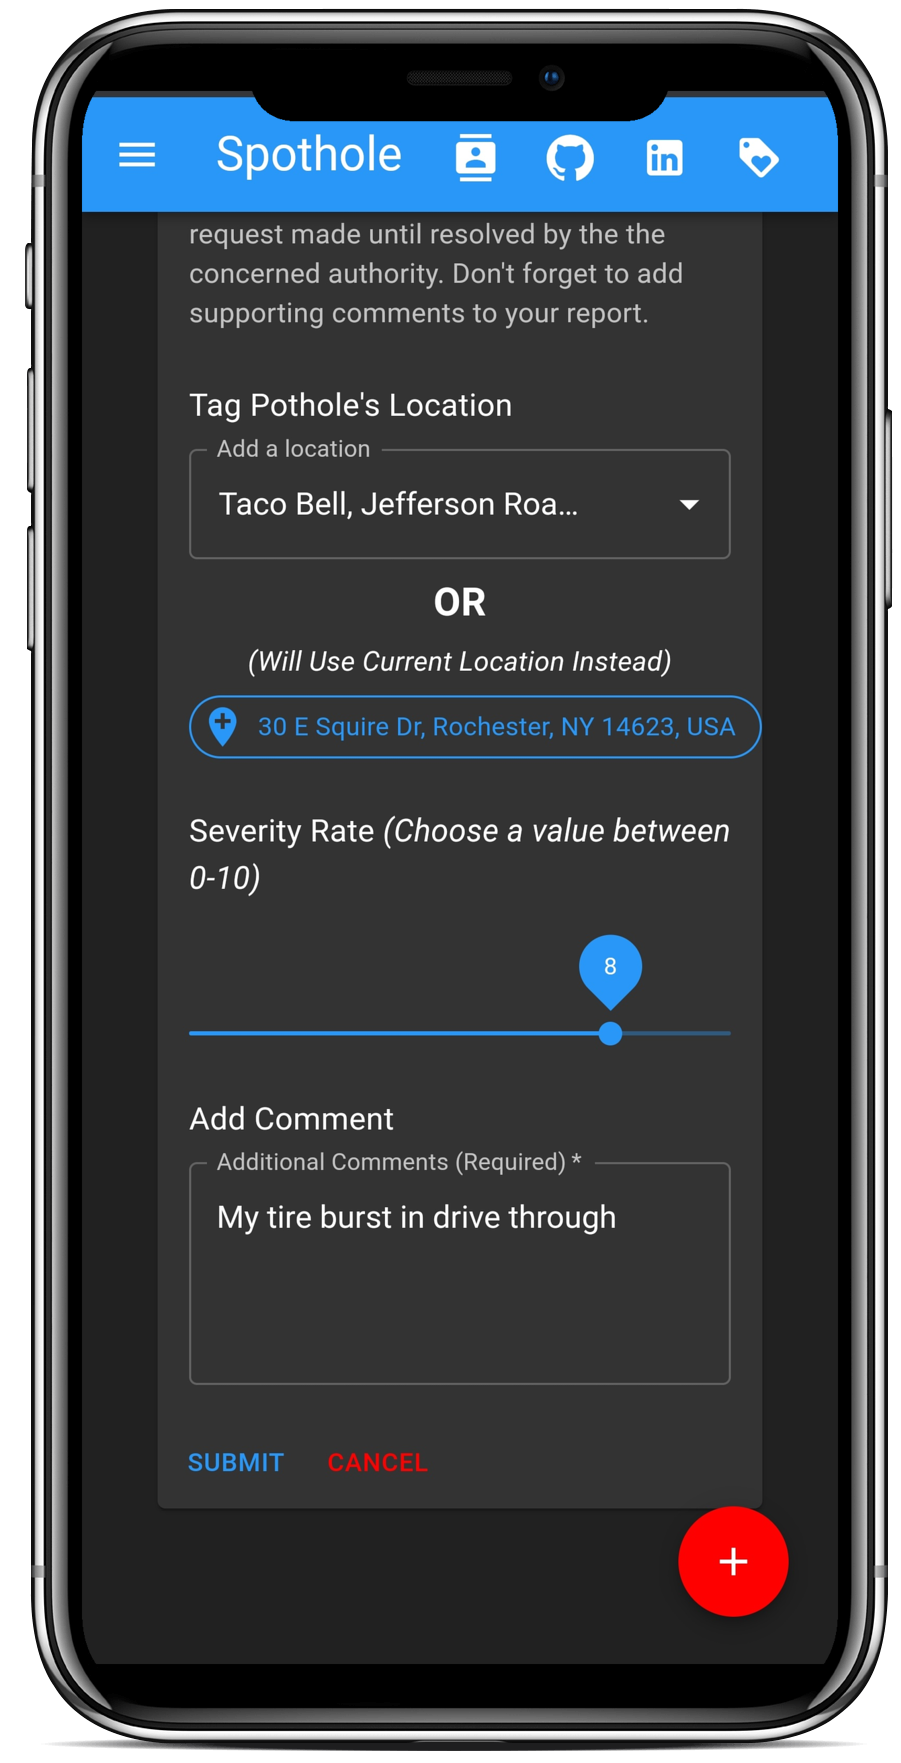
5. Assuming that the uploaded image is validated successfully, users are given the option to select a location either current or to enter a custom location. After which users are asked to use a progress indicator to specify how severe the reported pothole is according to them.
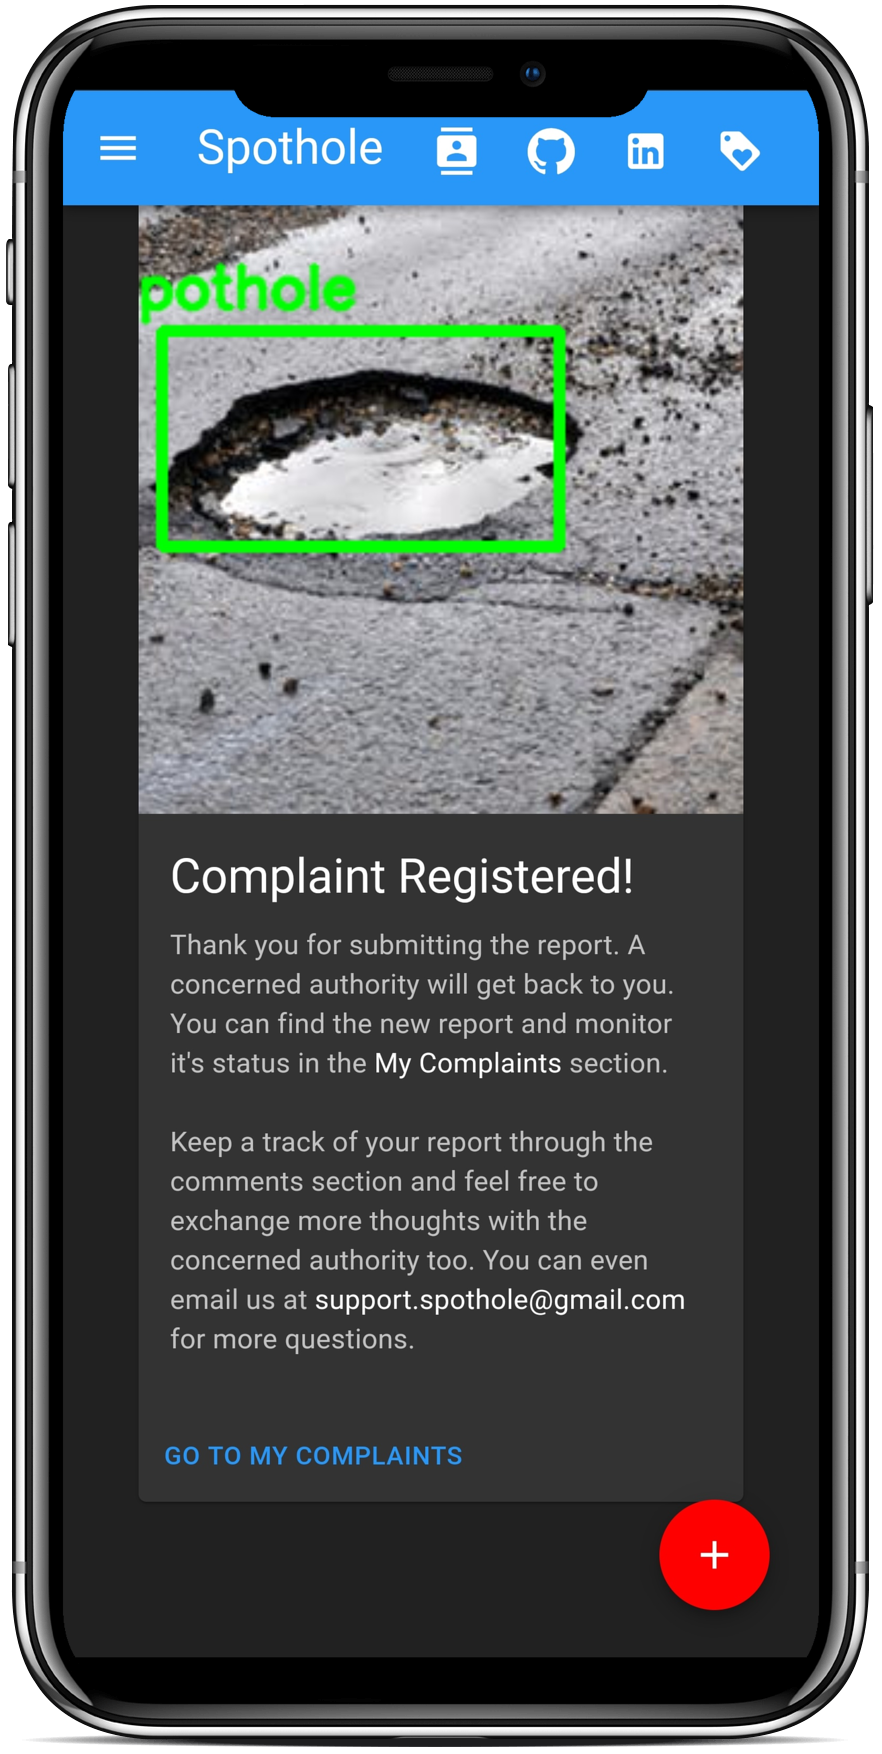
6. Finally they are asked to give more details about their report using a description box. Once the user has successfully submitted the report, they can now view the same using the My Complaints Screen.
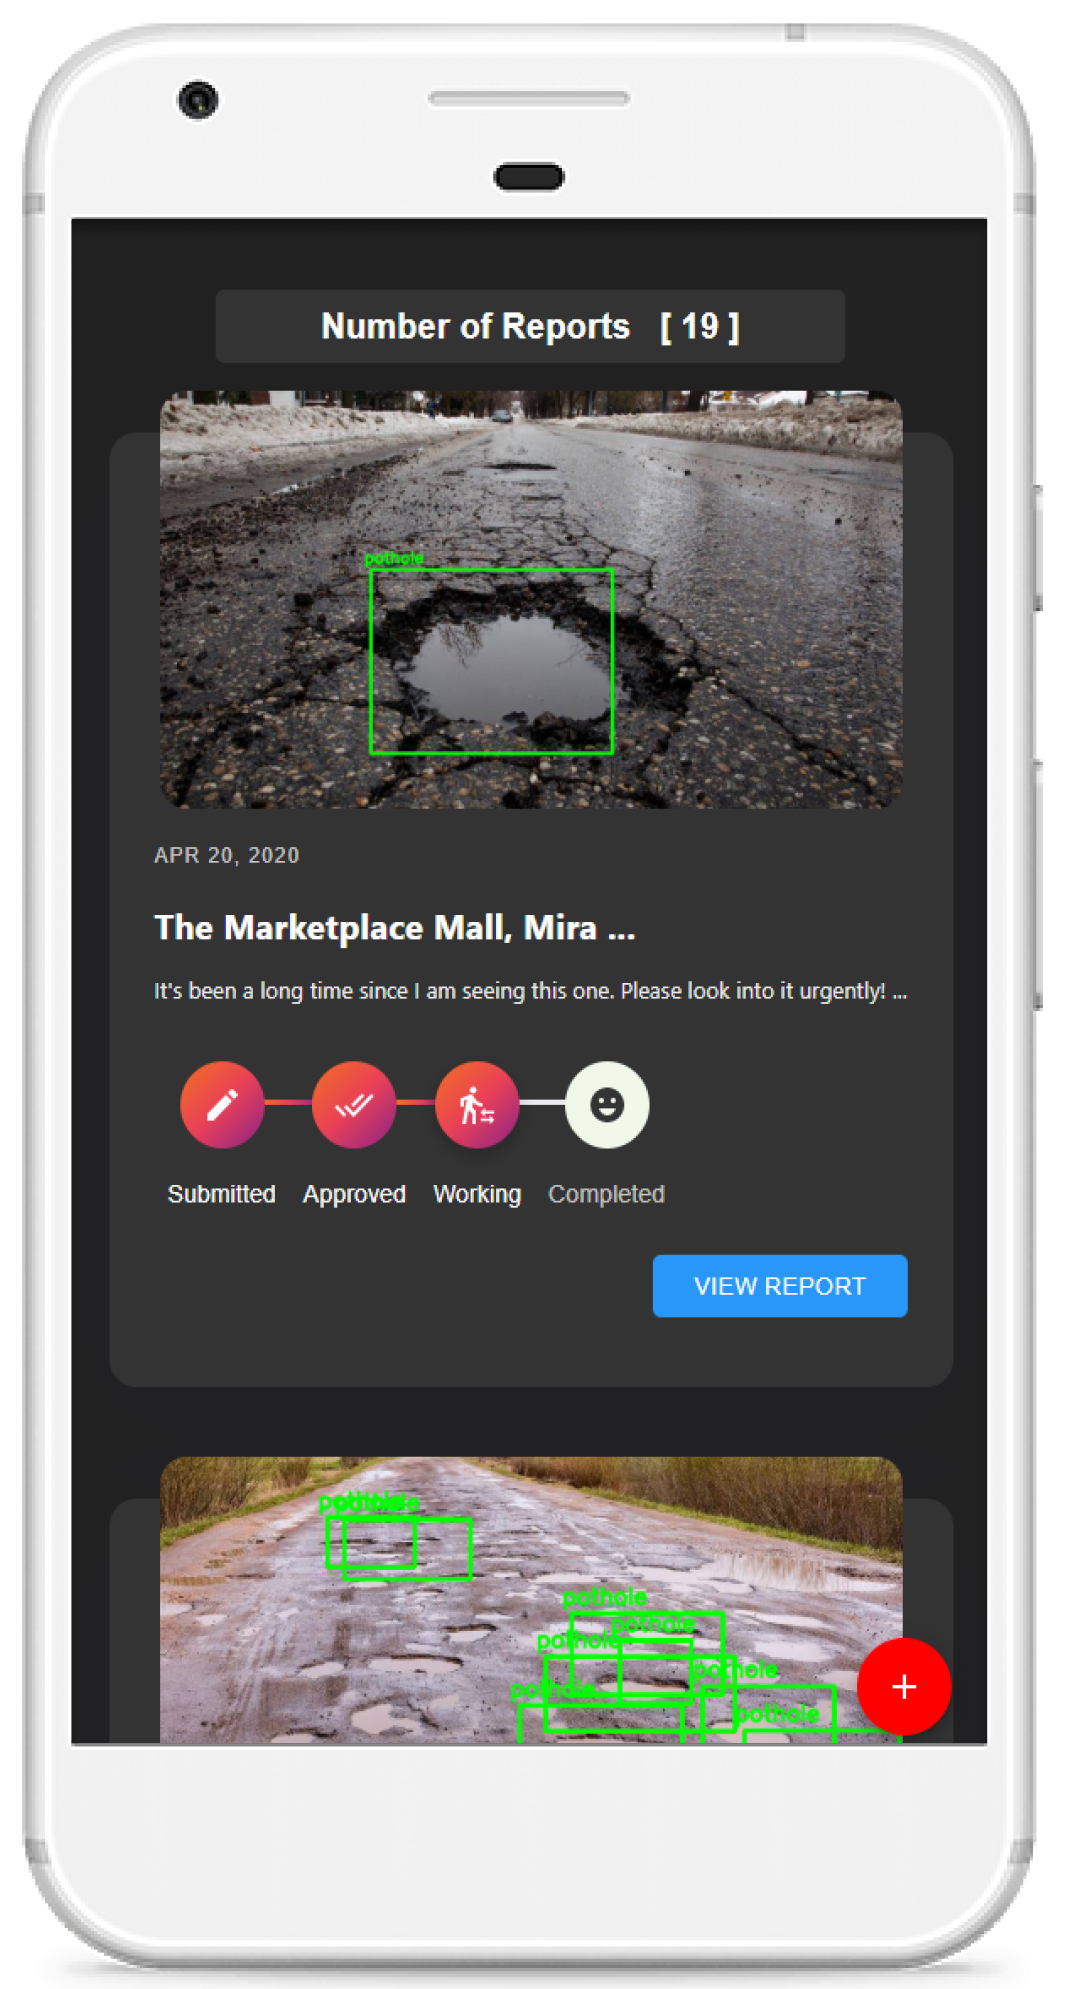
1. On signing into the app with their Google Accounts, users are presented with the My Complaints Screen.
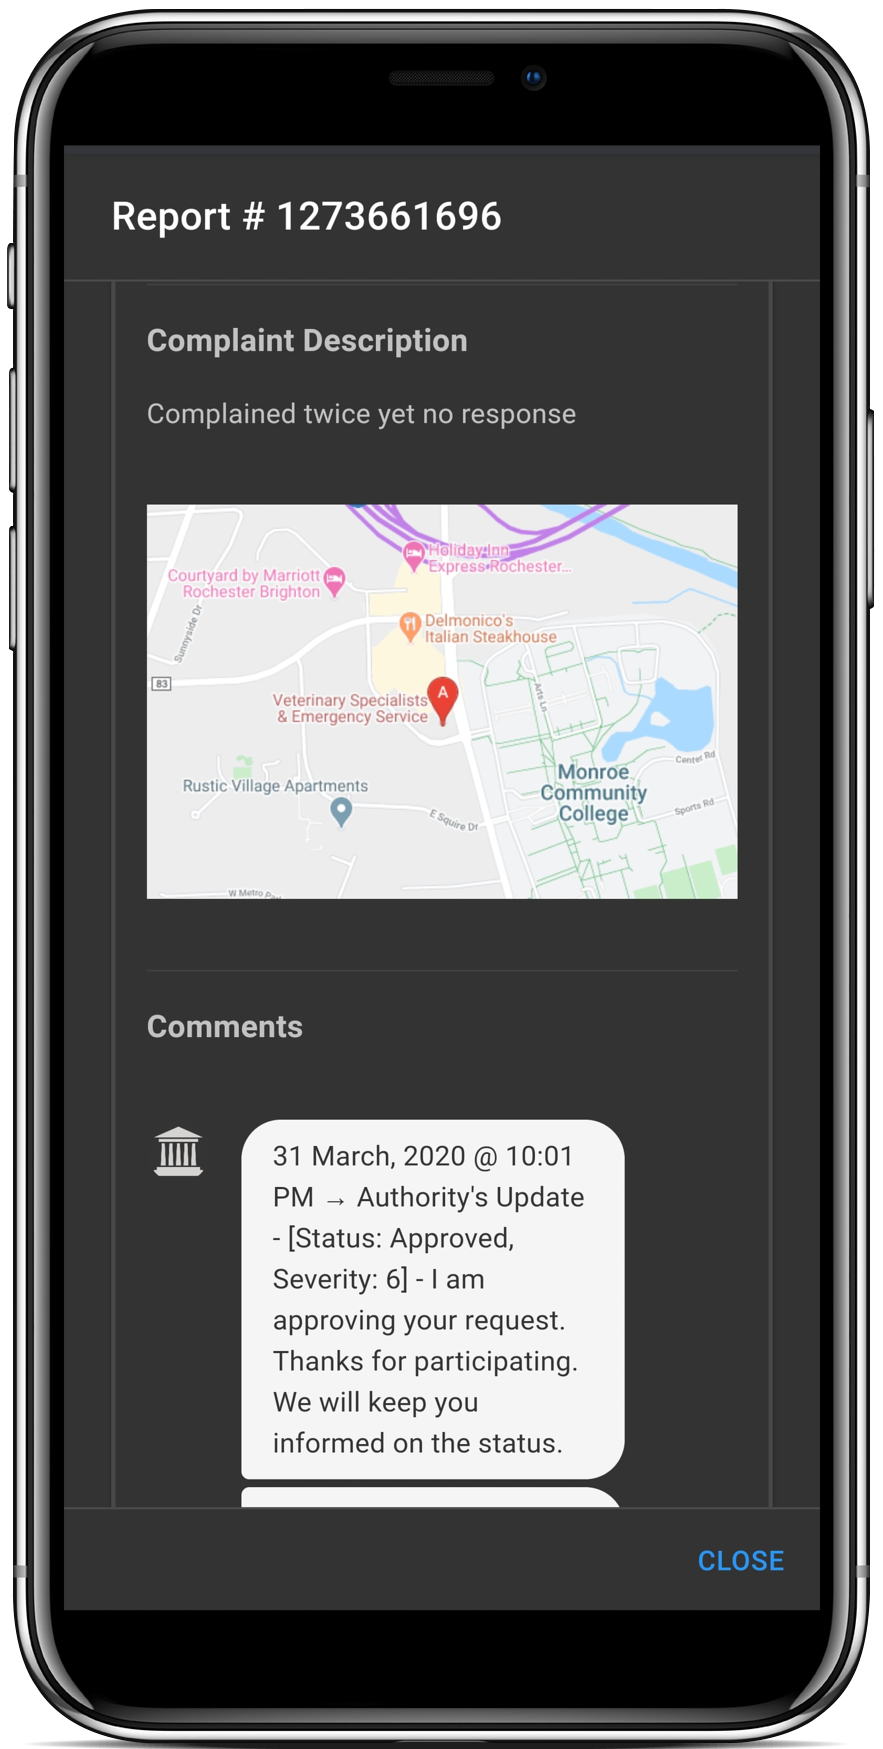
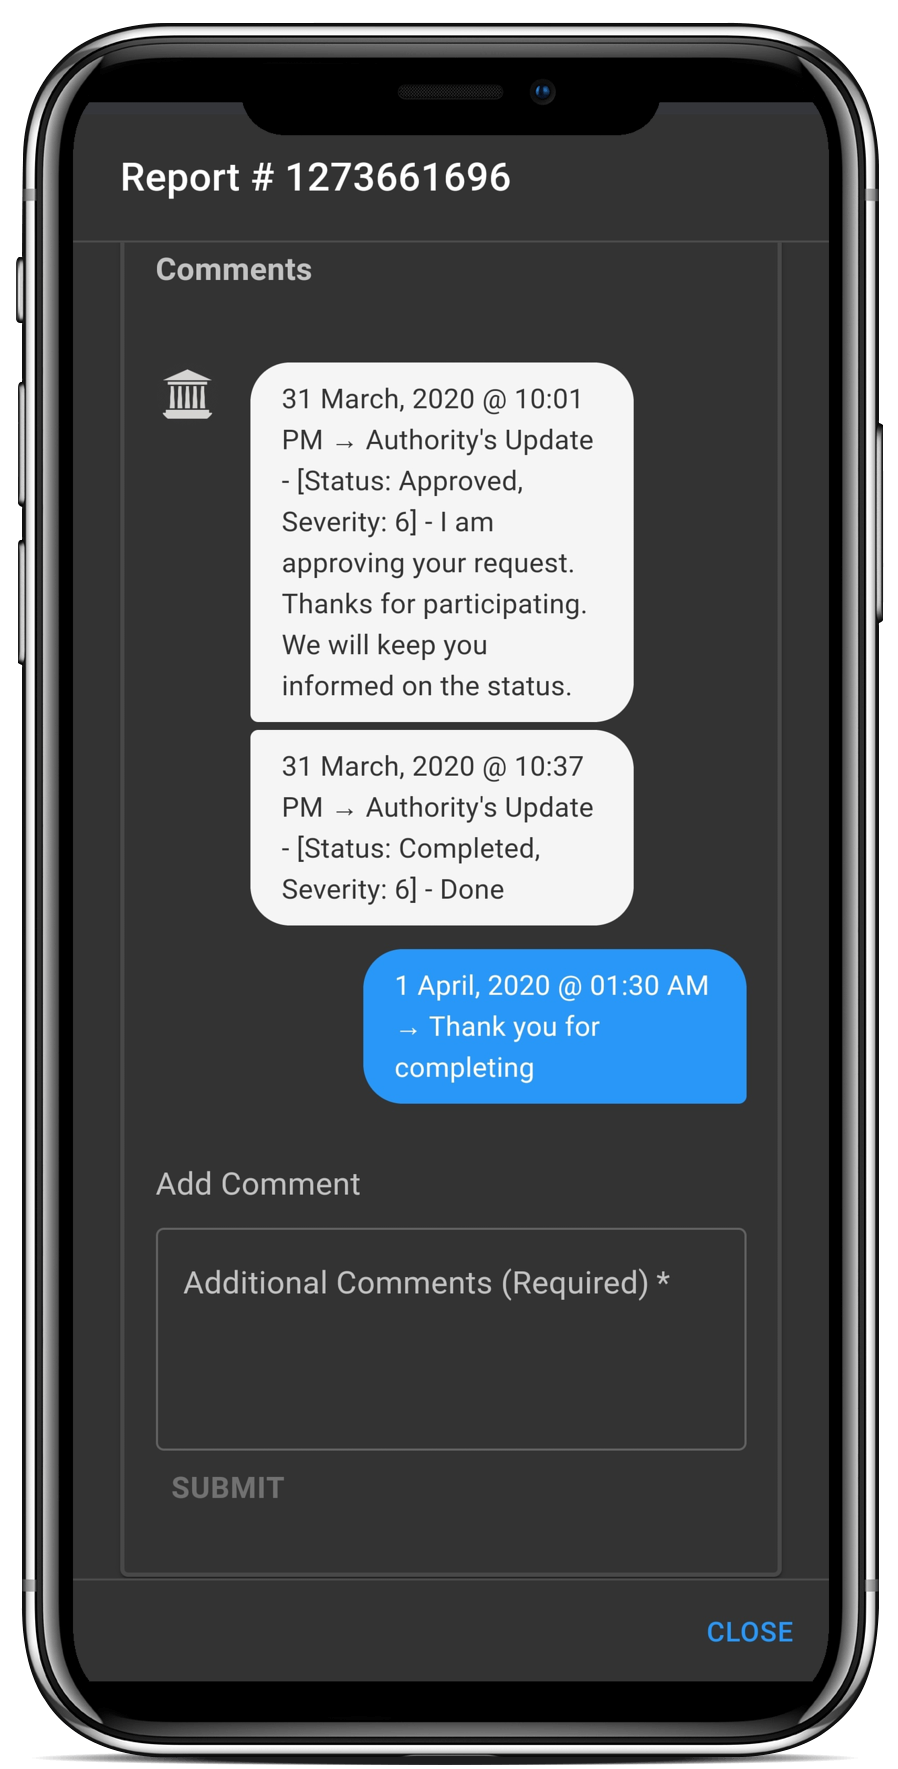
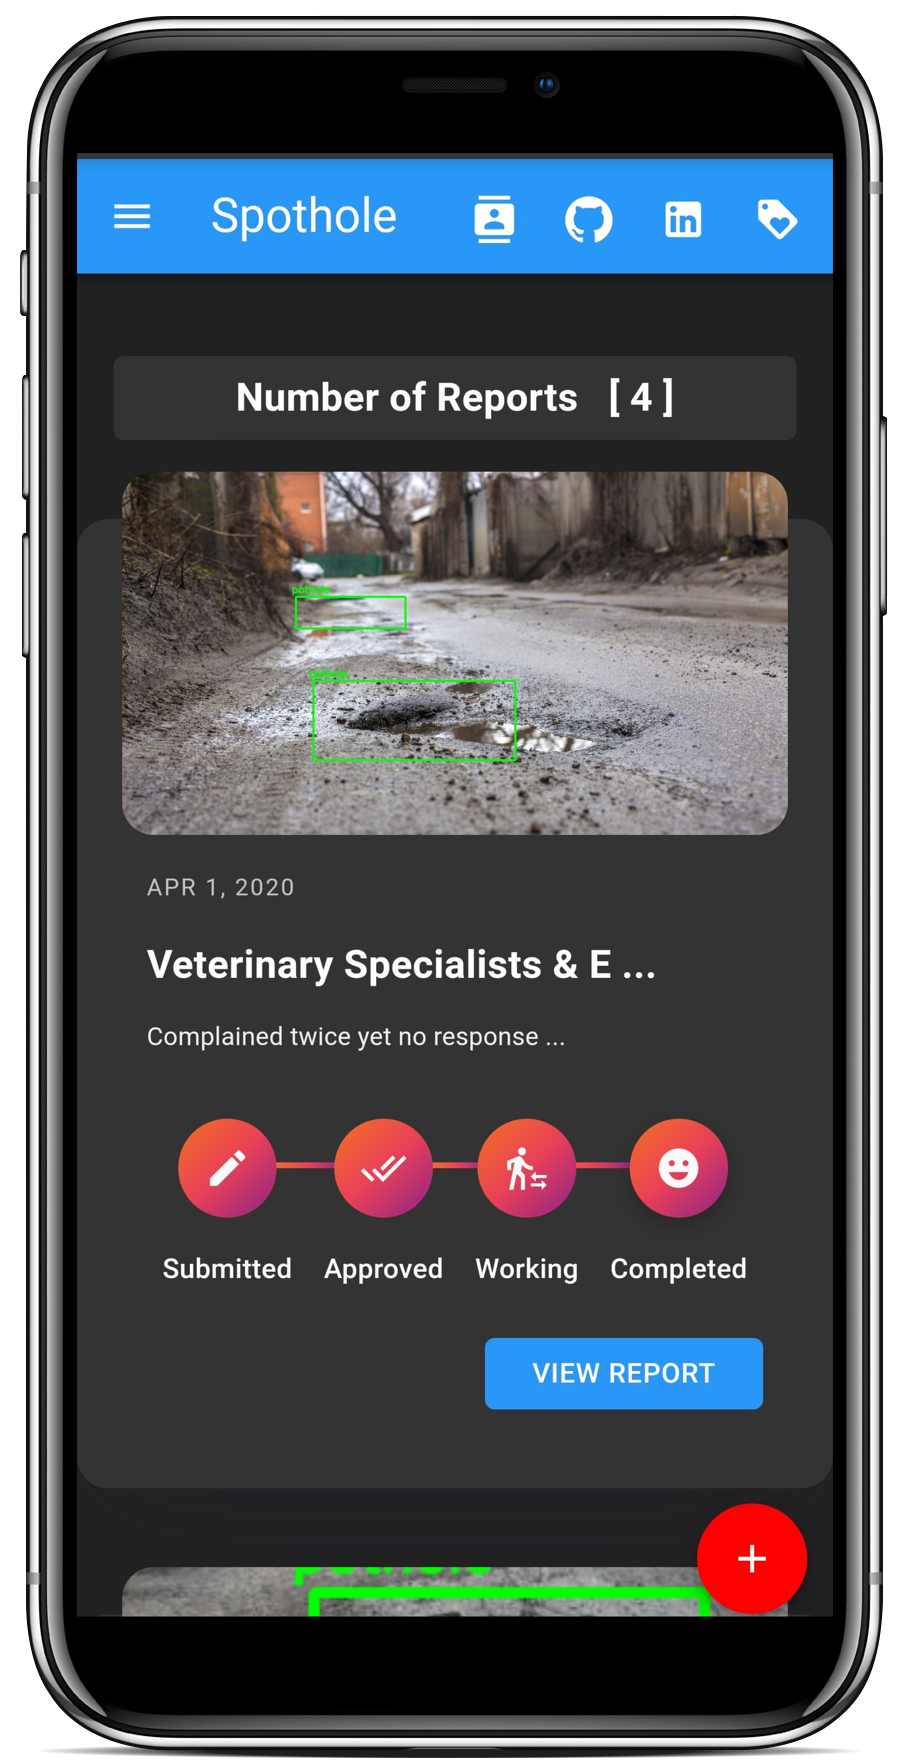
2. Existing users who have at least one report created can manage the status of their report and add additional comments to it or reply on comments from authorities using this section of the App.
3. Users can click on any of the reports to view the detailed description for the report and monitor any notifications or to communicate with the authority through the chat section.

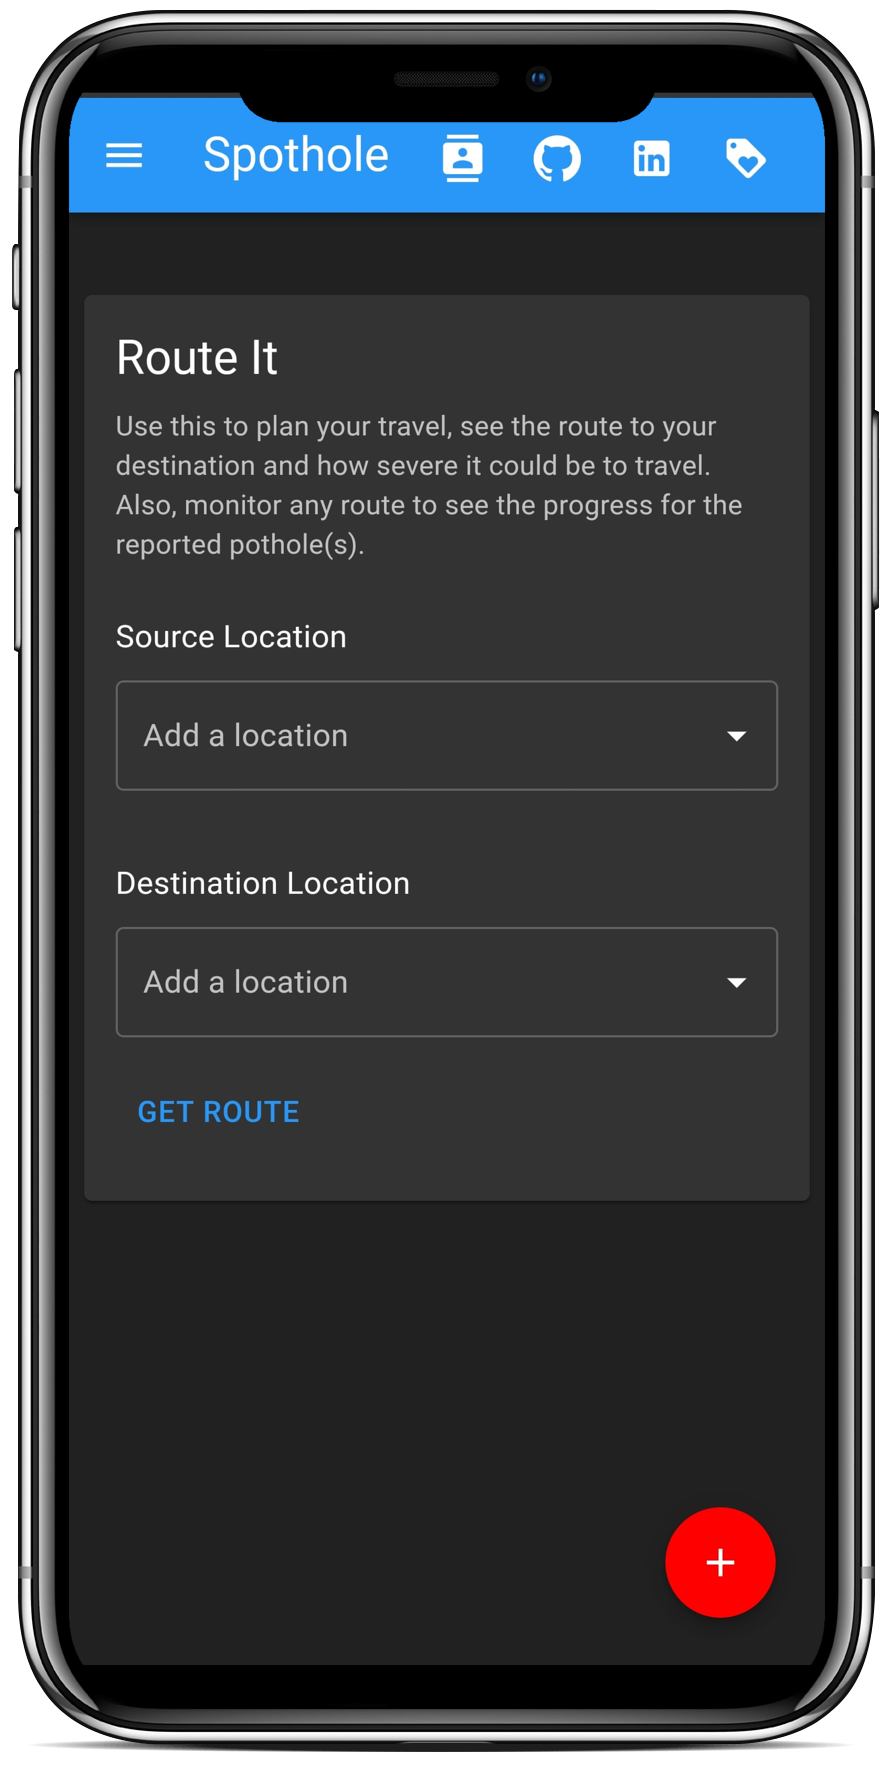
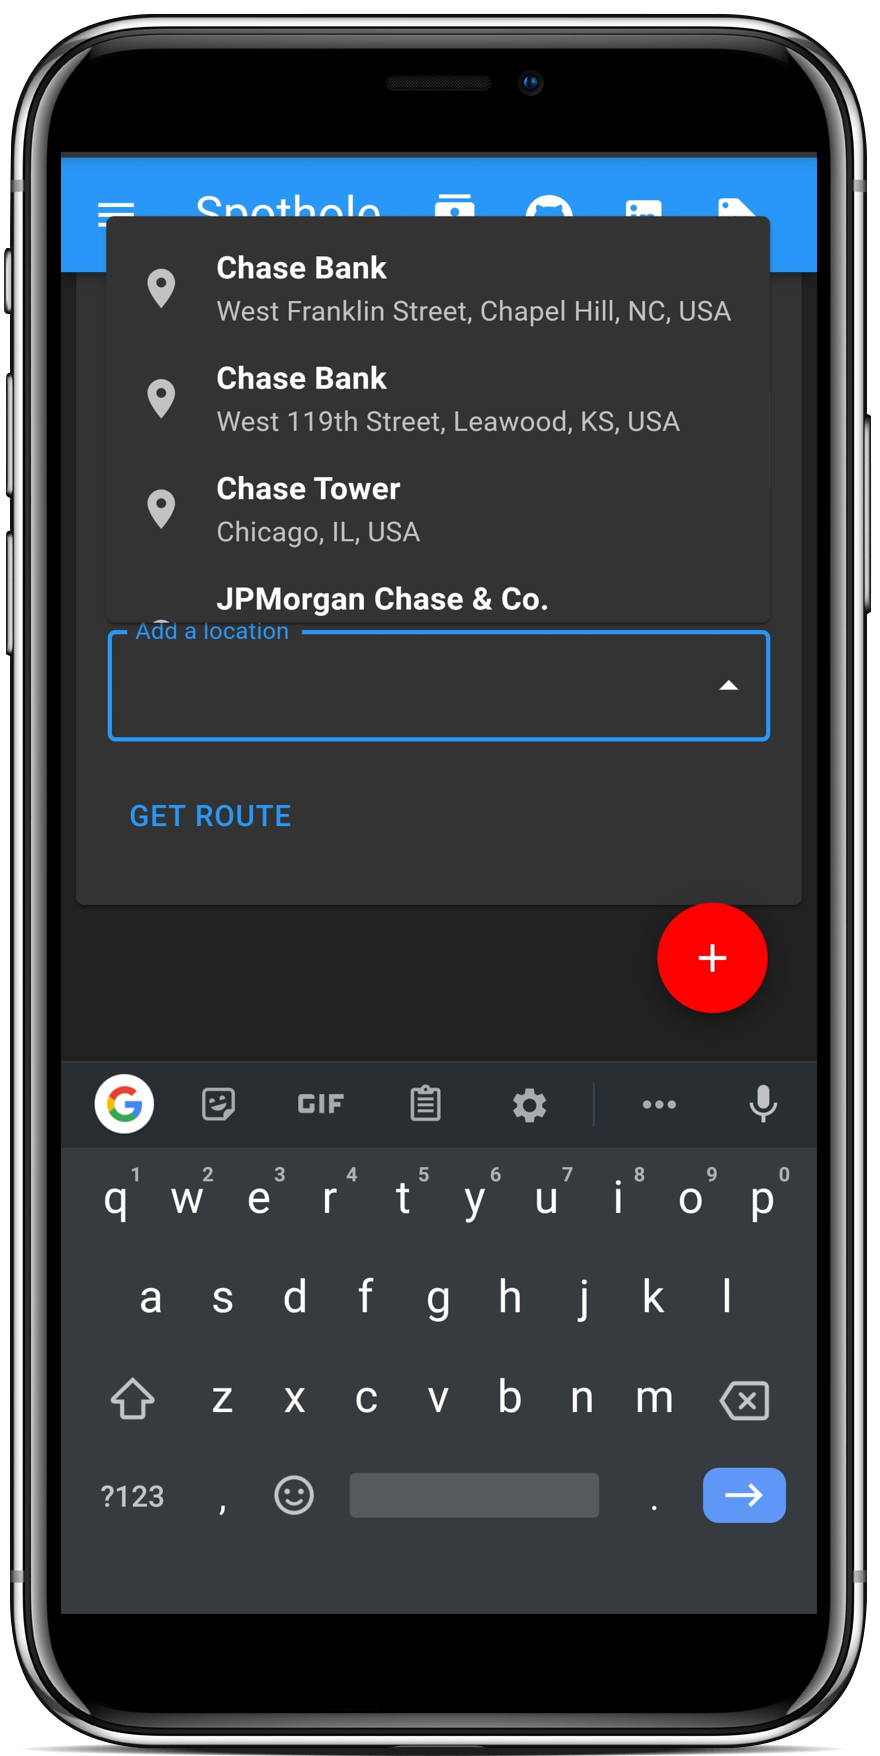
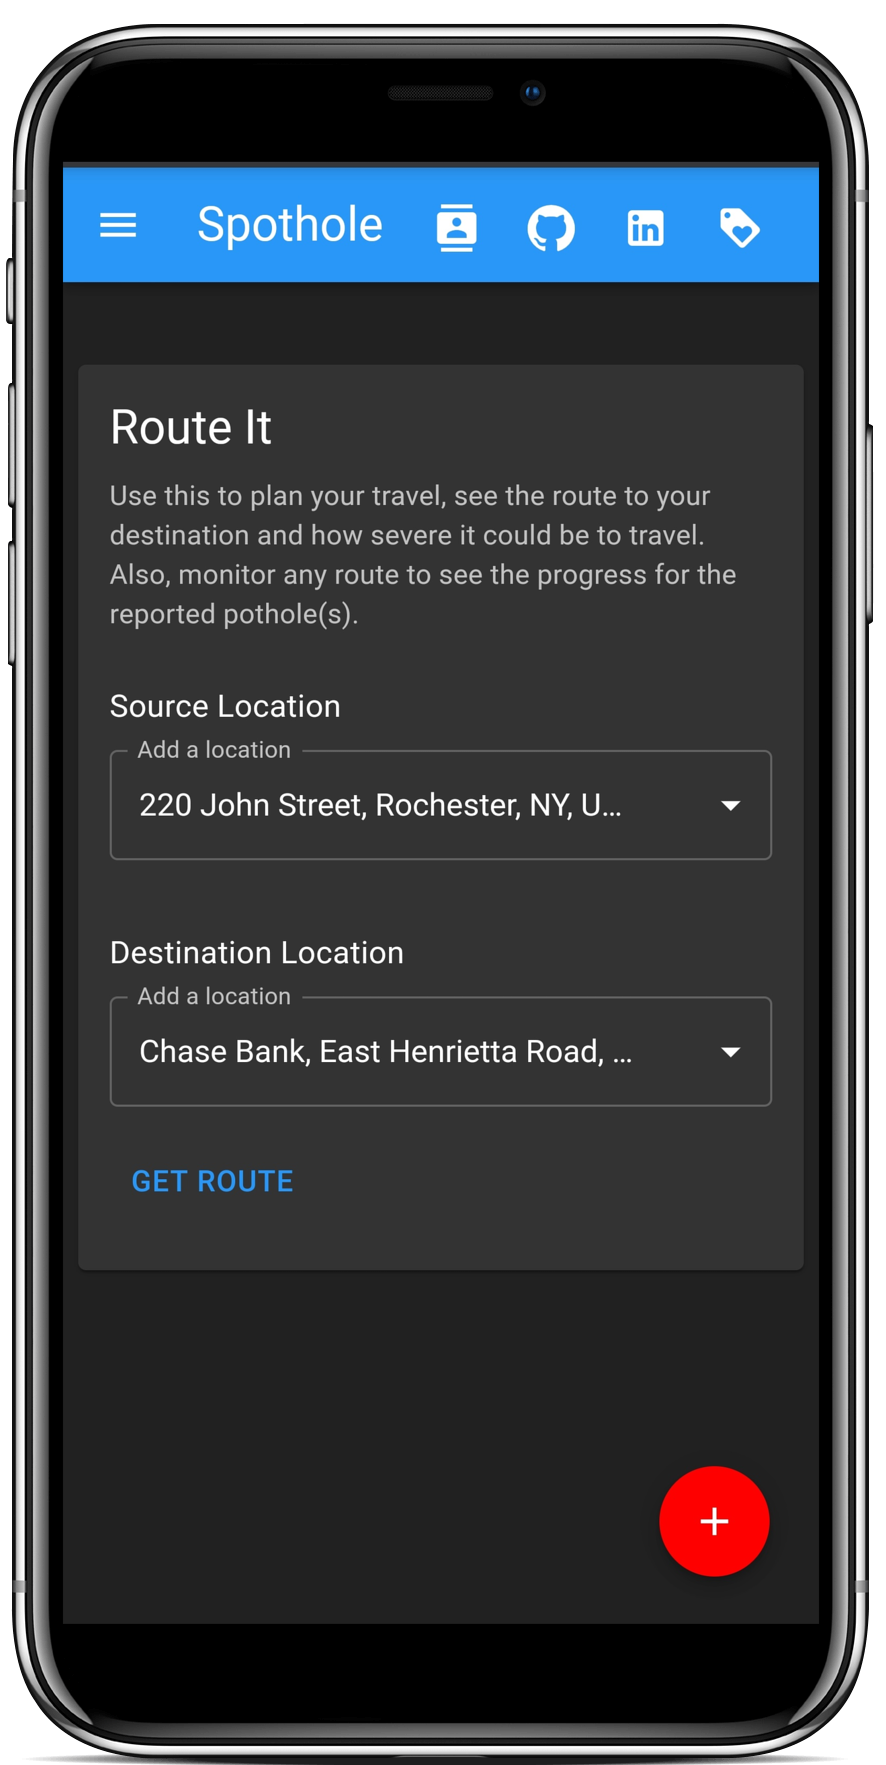
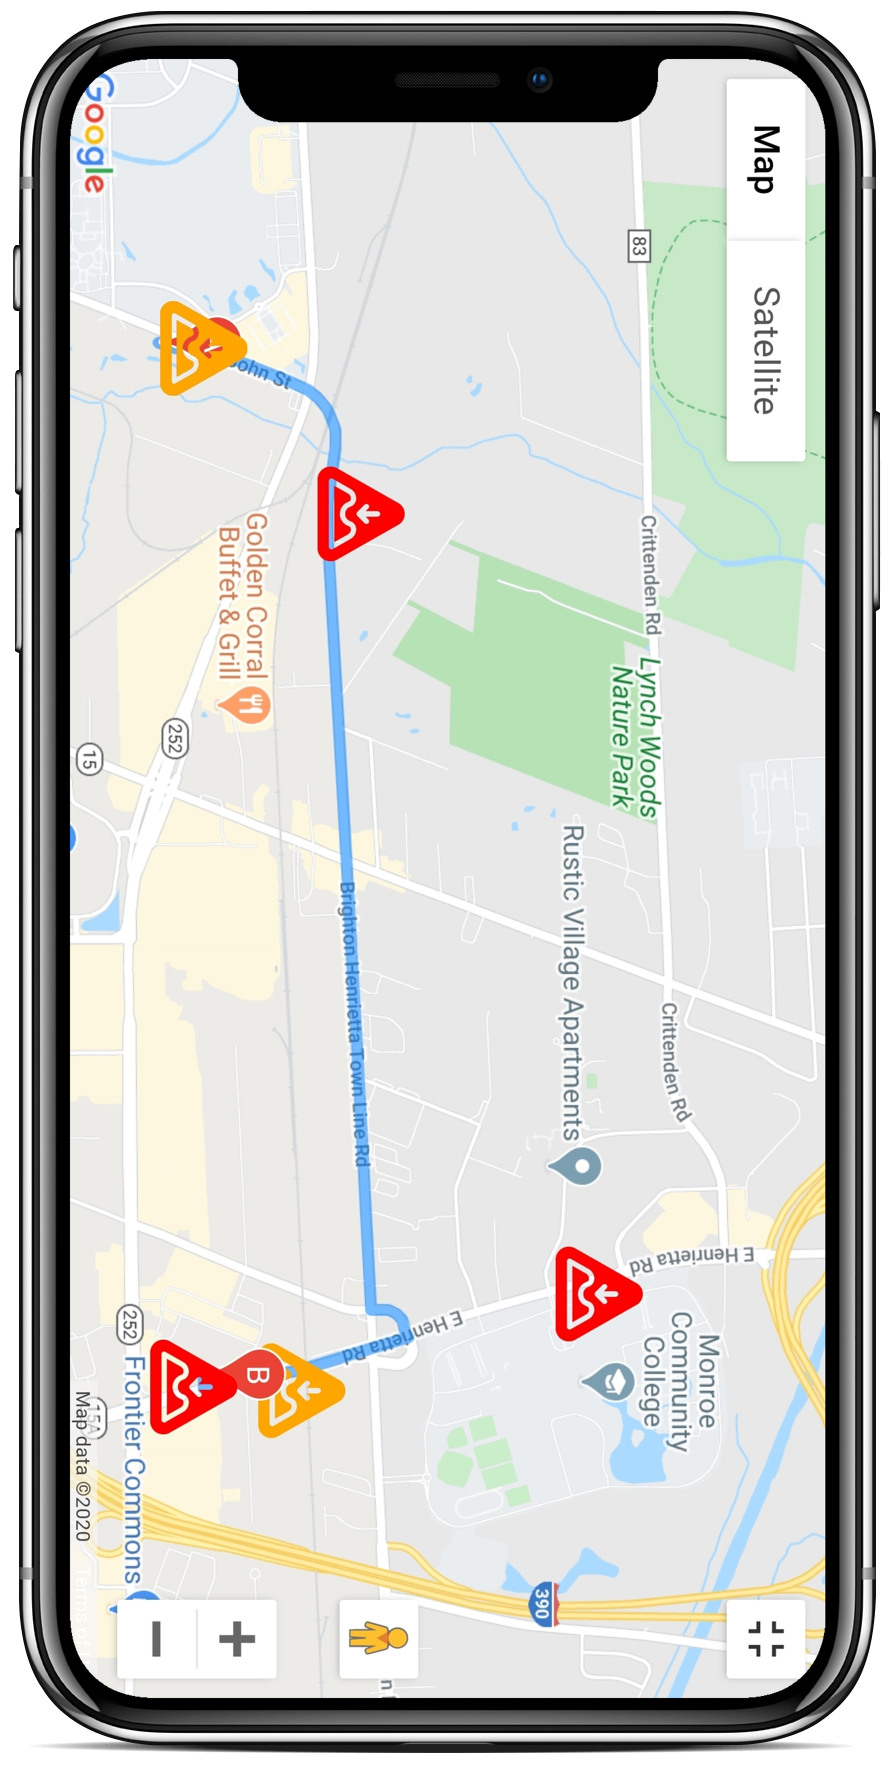
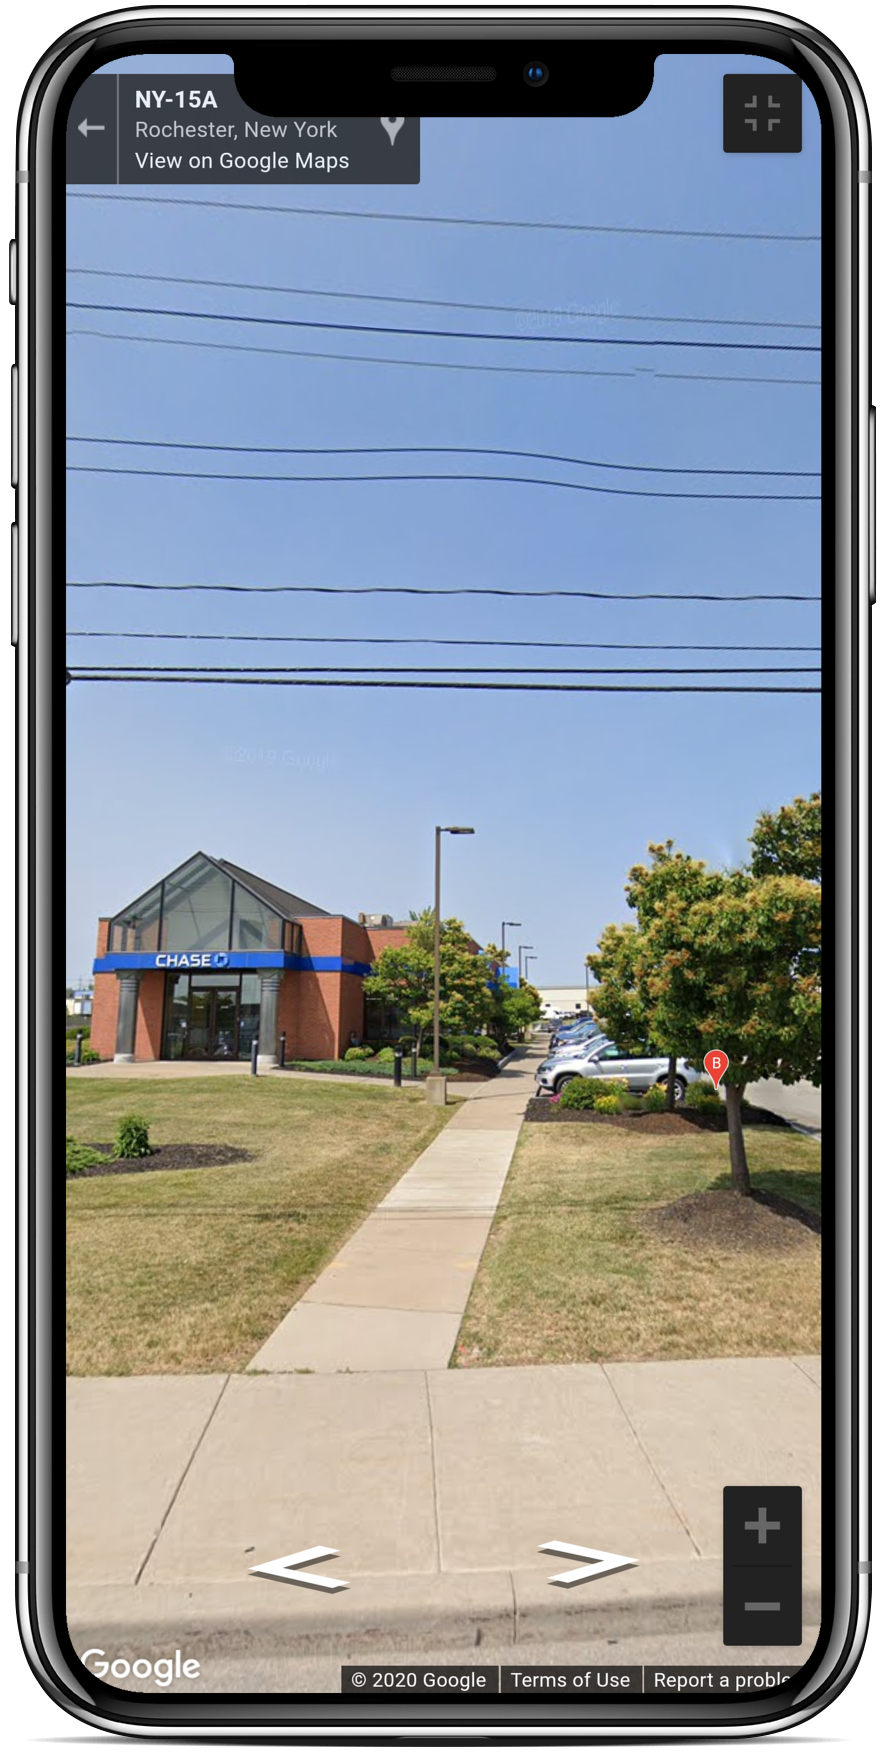
1. This screen presents the user with an option to enter the source and destination location to track a route.
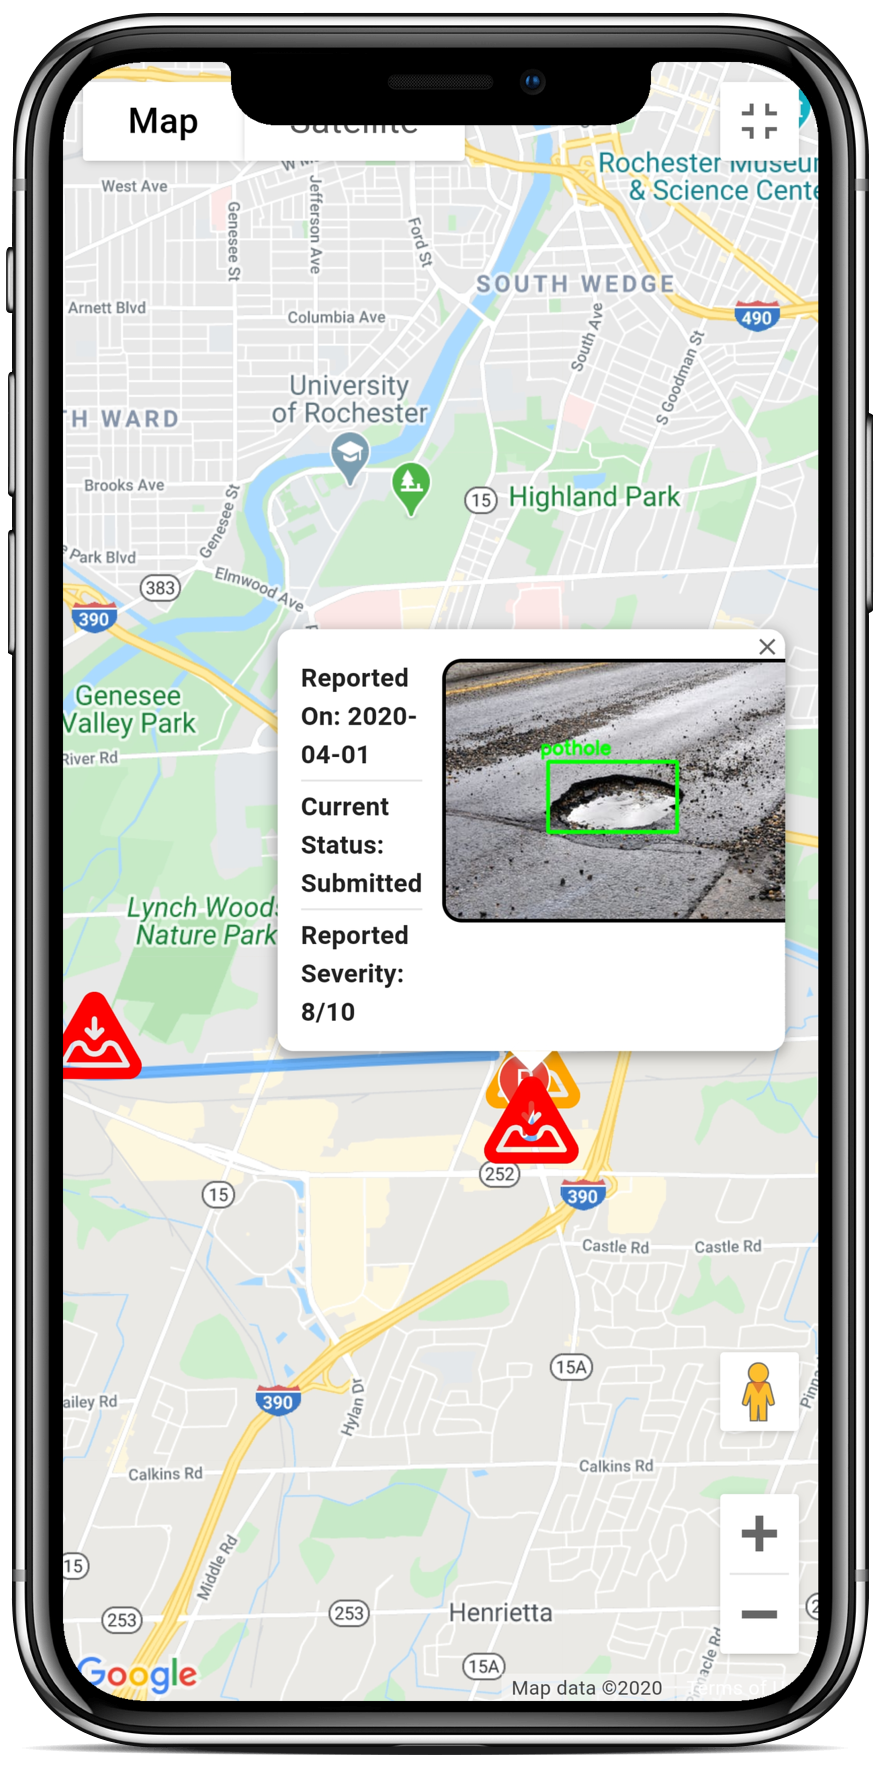
2. The route displays the marked potholes on the path which were approved by the authorities. It uses Google's Maps API to build the route. Custom markers for potholes with status approved ranging on severity are presented to the user on the route if they are close to the route.
3. A legend explaining the different attributes of the map is presented to the user. Also, there is a street view renderer for the users. This screen can be used by any logged in user to monitor a route and the status for the different potholes on it and plan travel accordingly.

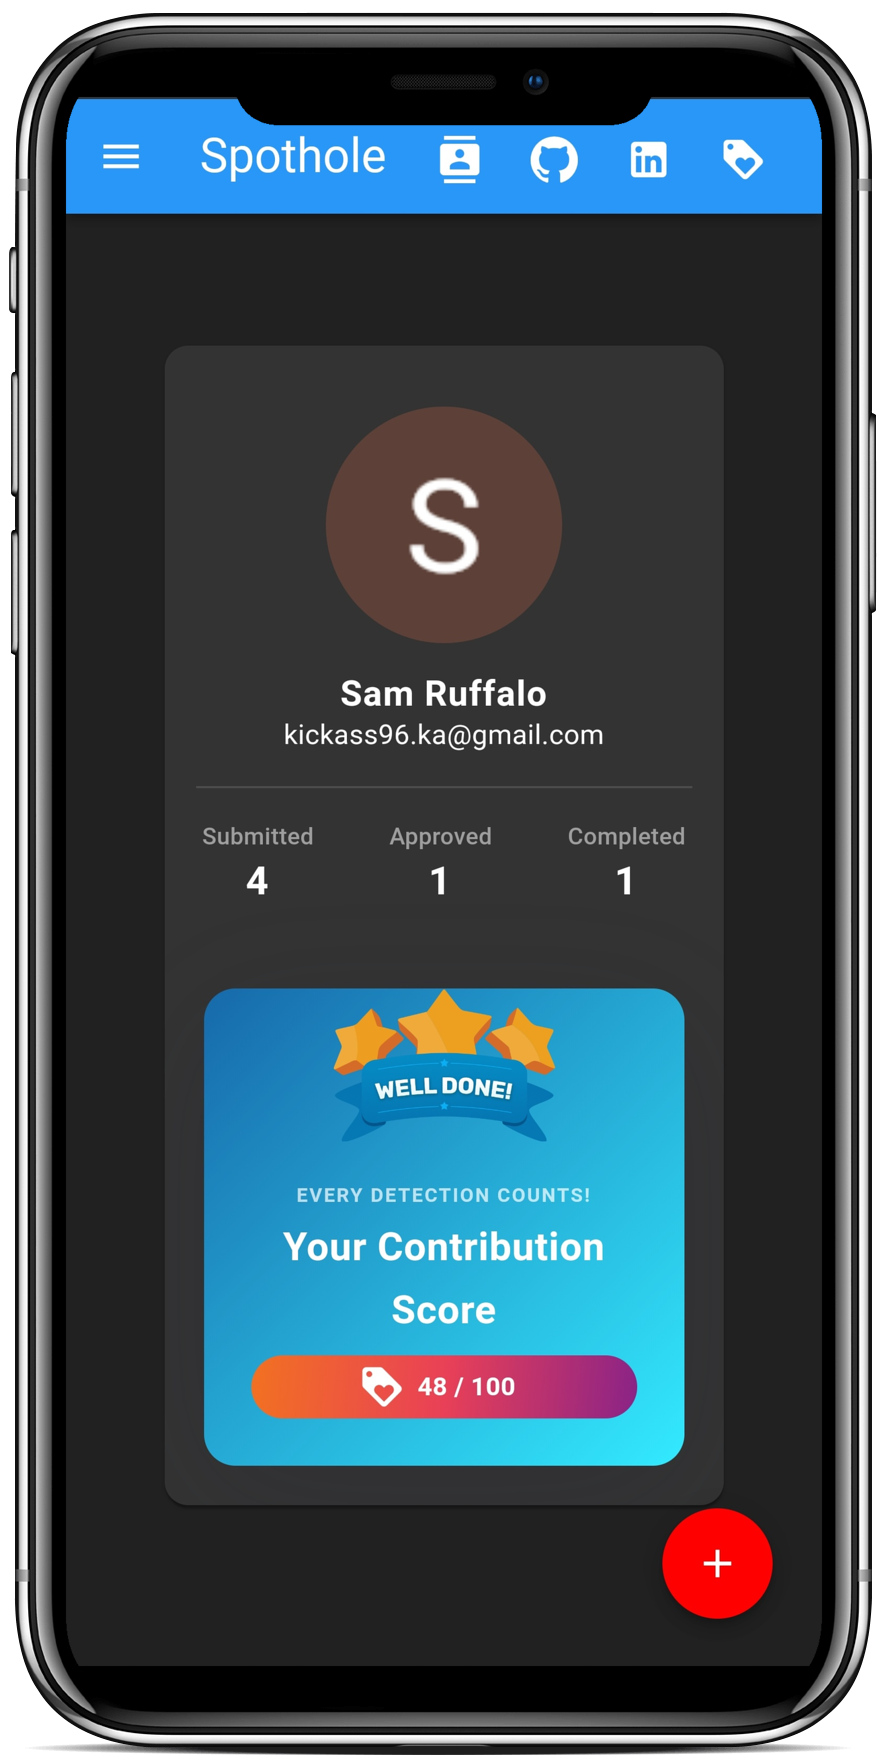
1. This screen contains the basic details of a user (avatar, name, email address).
2. It is then followed by a counter for reports with a status of either submitted, approved or completed. Based on the above counters the user is assigned with a badge score indicating their contribution to the community.
3. This score is a weighted average score based on the counters mentioned above. This score will later be used for rewarding the user.

The citizen's application has a number of screens and visual interfaces associated. Here's a section showcasing a few snaps on different devices.
Here are some important URLs developers can use to learn more about the application
An application for managing reports and users, making updates on complaints, communicating with the concerned citizens and visualizing complaints using different techniques. In other words an app for the concerned authorities.
The authority's application has been divided into four main sections. Here's a detailed description of each of the sections.
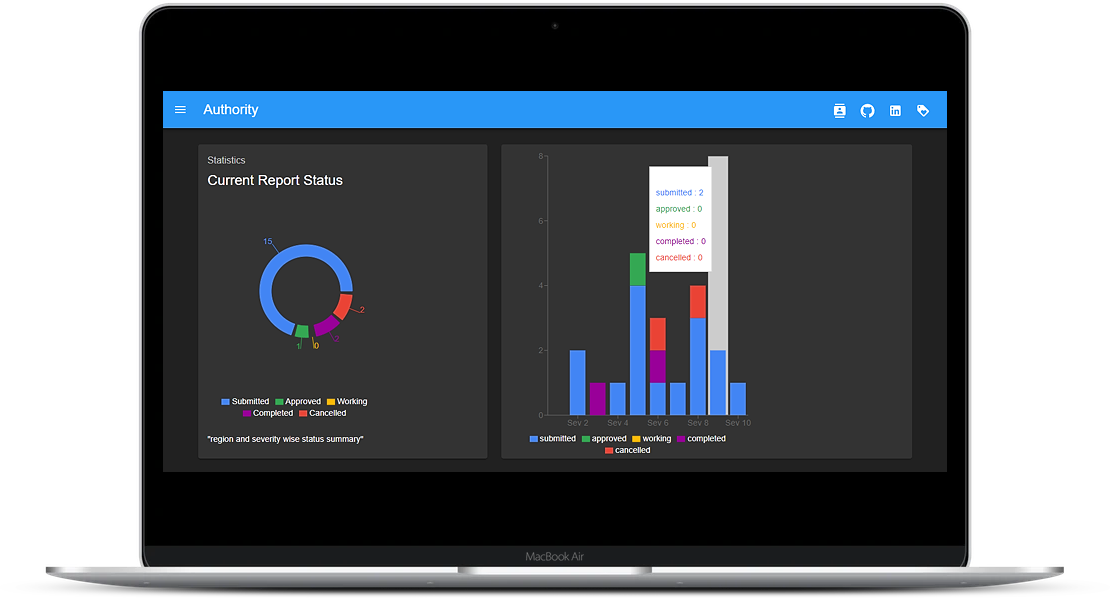
1. Once the authority has signed in successfully, they are presented with the dashboard screen which is divided into two main sections.
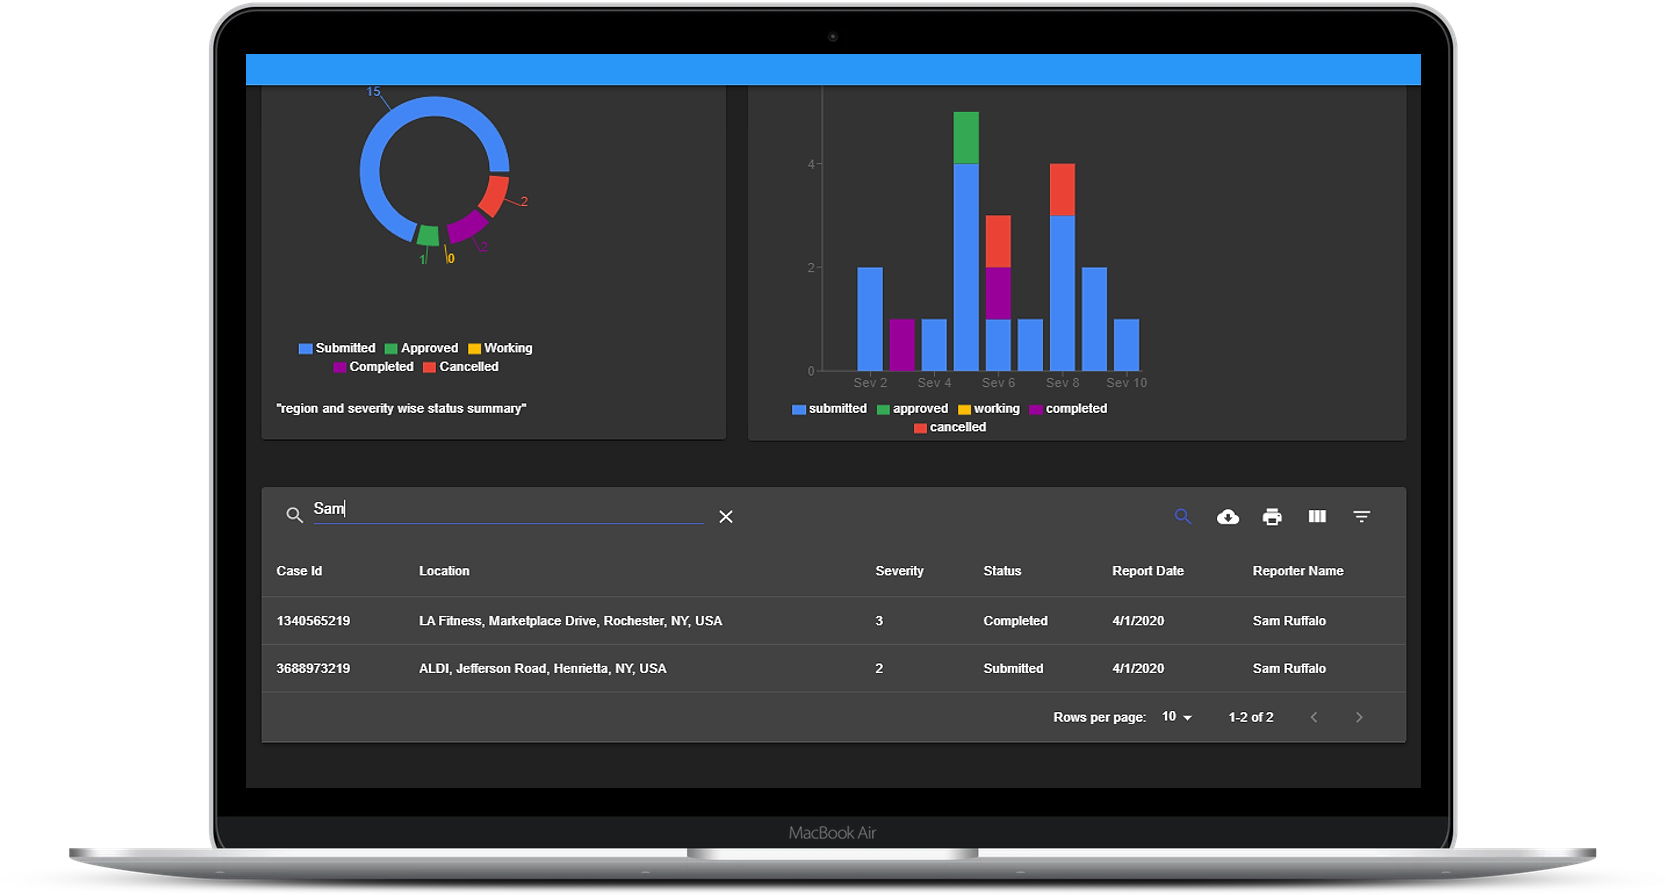
2. The first being the analytics section. This has a donut chart which shows a high level view of the user reports in the authority's zone based on the status. Next to that is the stacked bar chart which provides a more detailed view of the status.
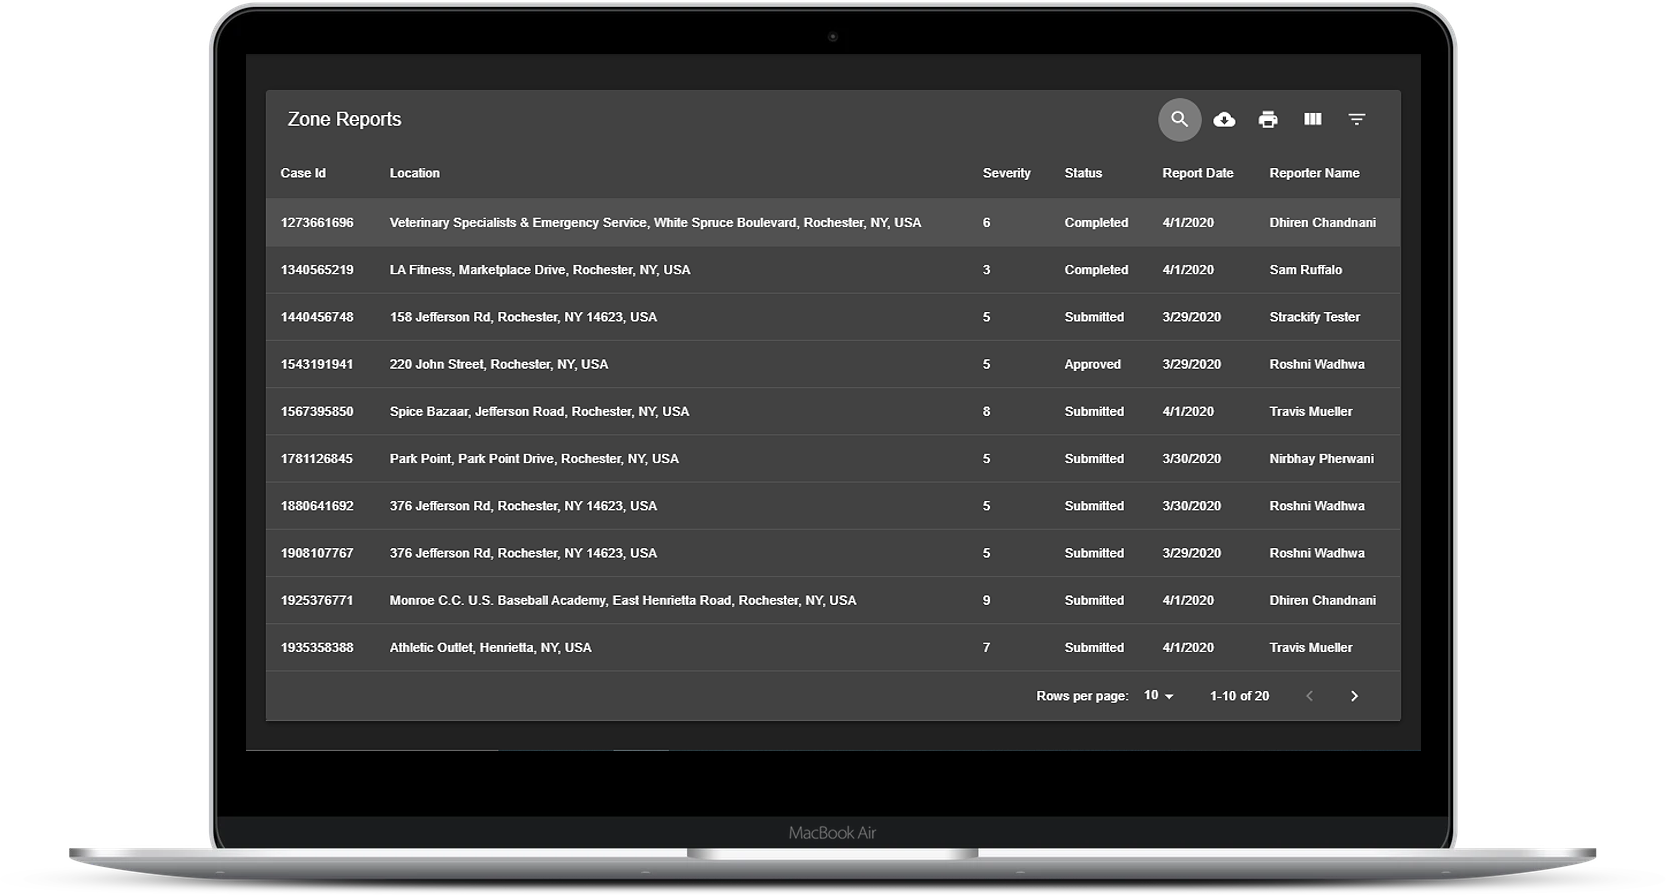
3. The second section on the dashboard is a filterable data table containing details about the various user reports. There are options for sorting, filtering, selecting specific columns, searching, exporting the data as csv and printing the table contents too.
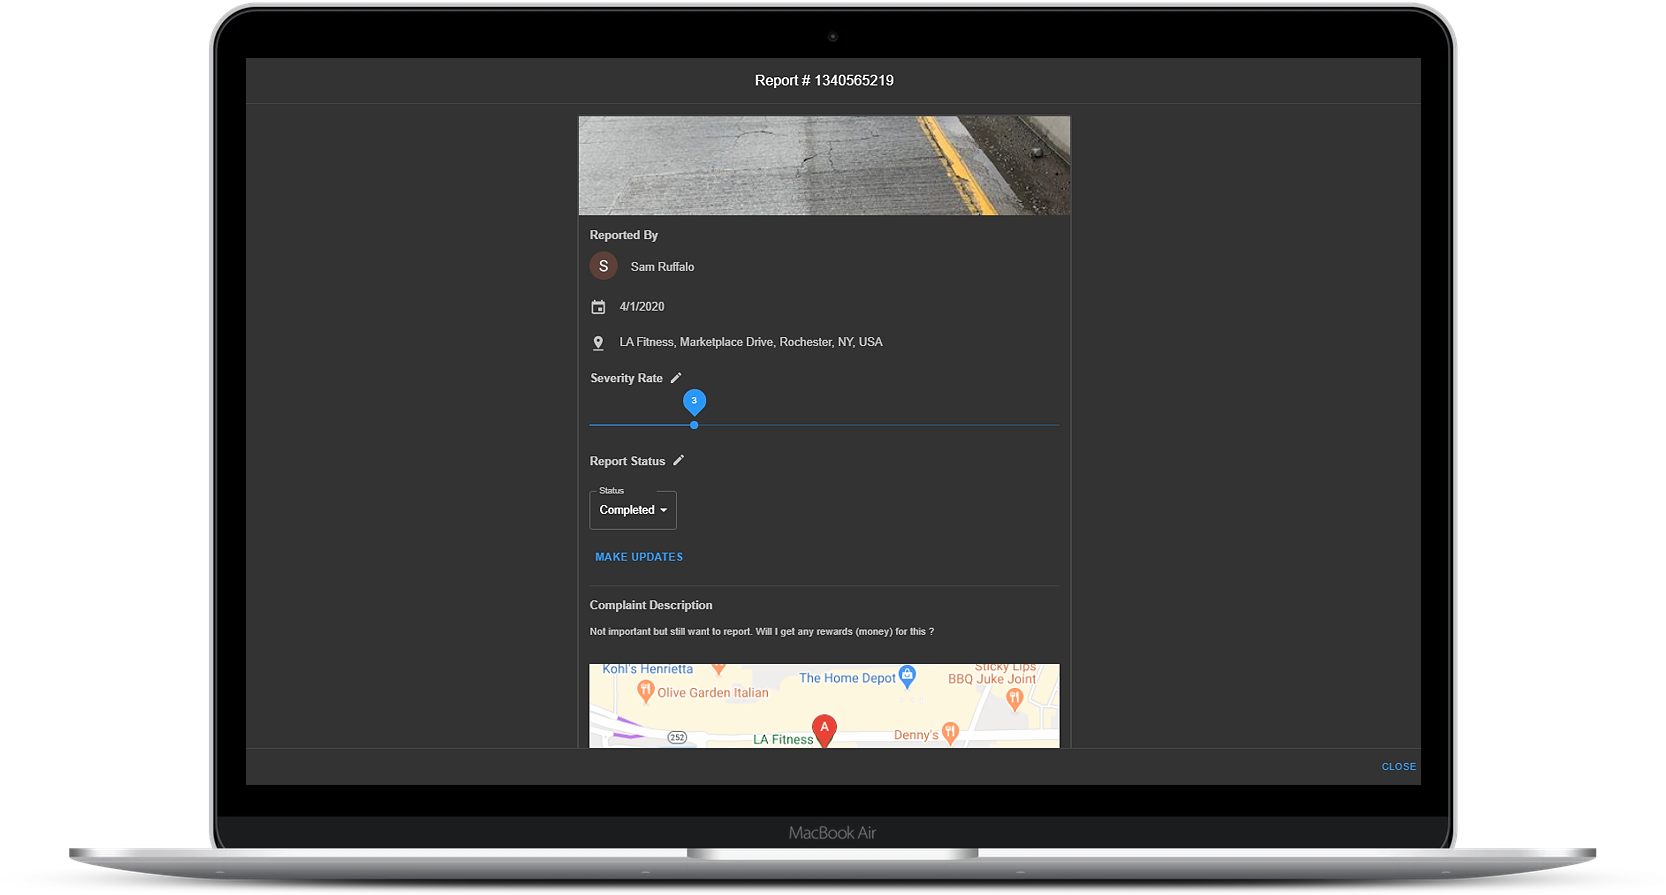
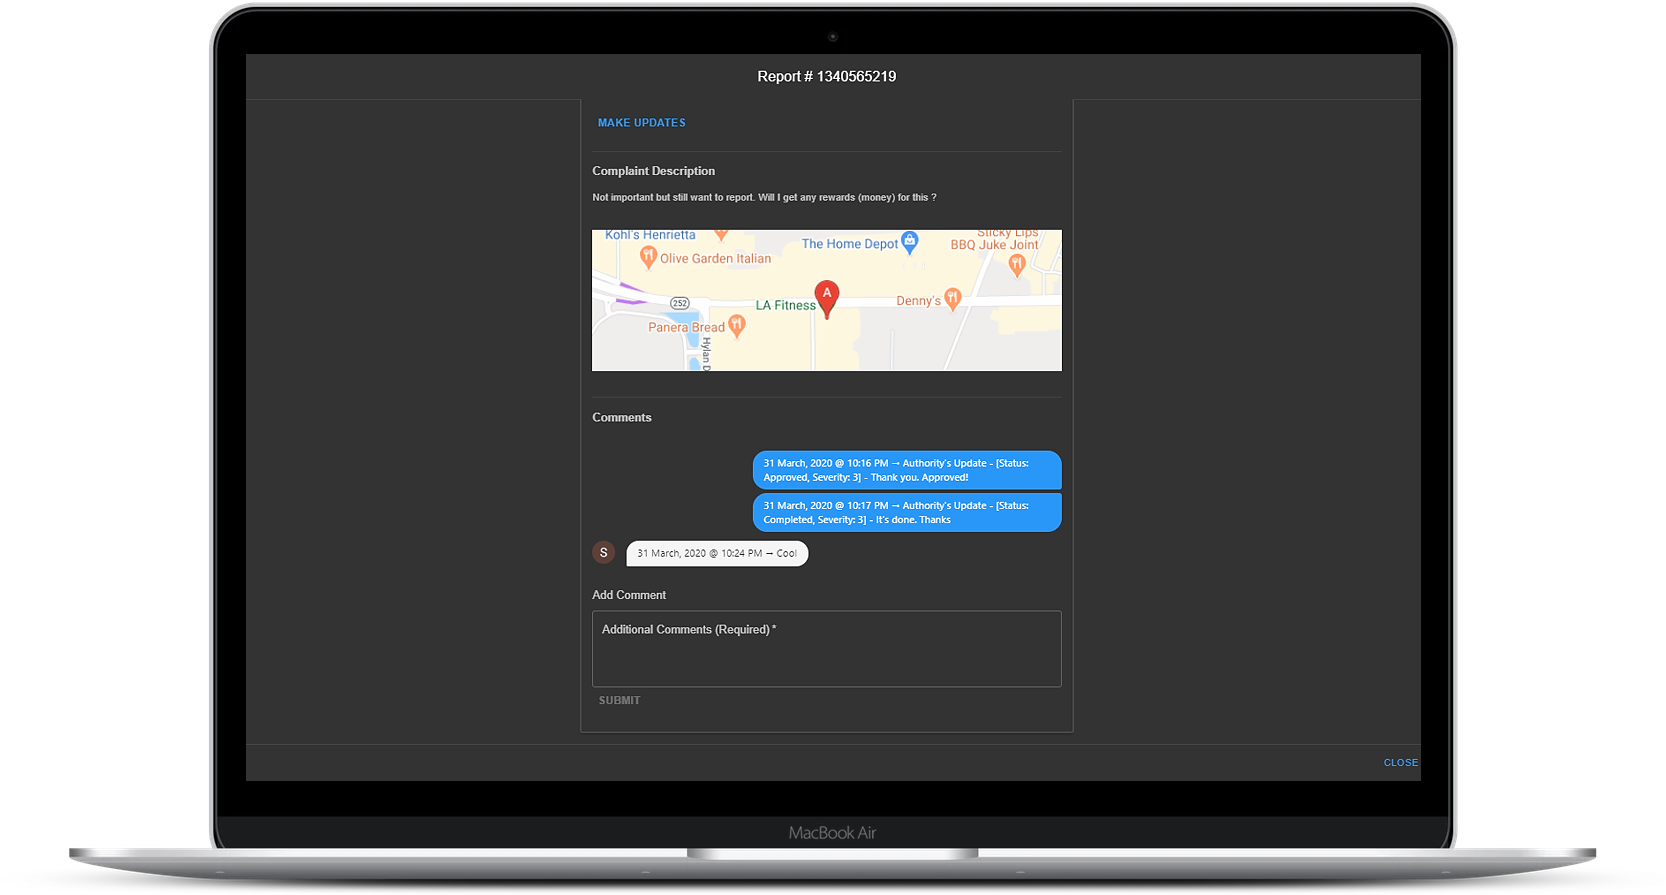
4. On clicking any report in the datatable, the authority is presented with the option to update it. Authories are required to provide reason for an update. Authorities can also comment on the report they clicked on and view all the other details of the report as a user would in their My Complaints screen.
5. Users are sent notifications through email after any update is made on their report.
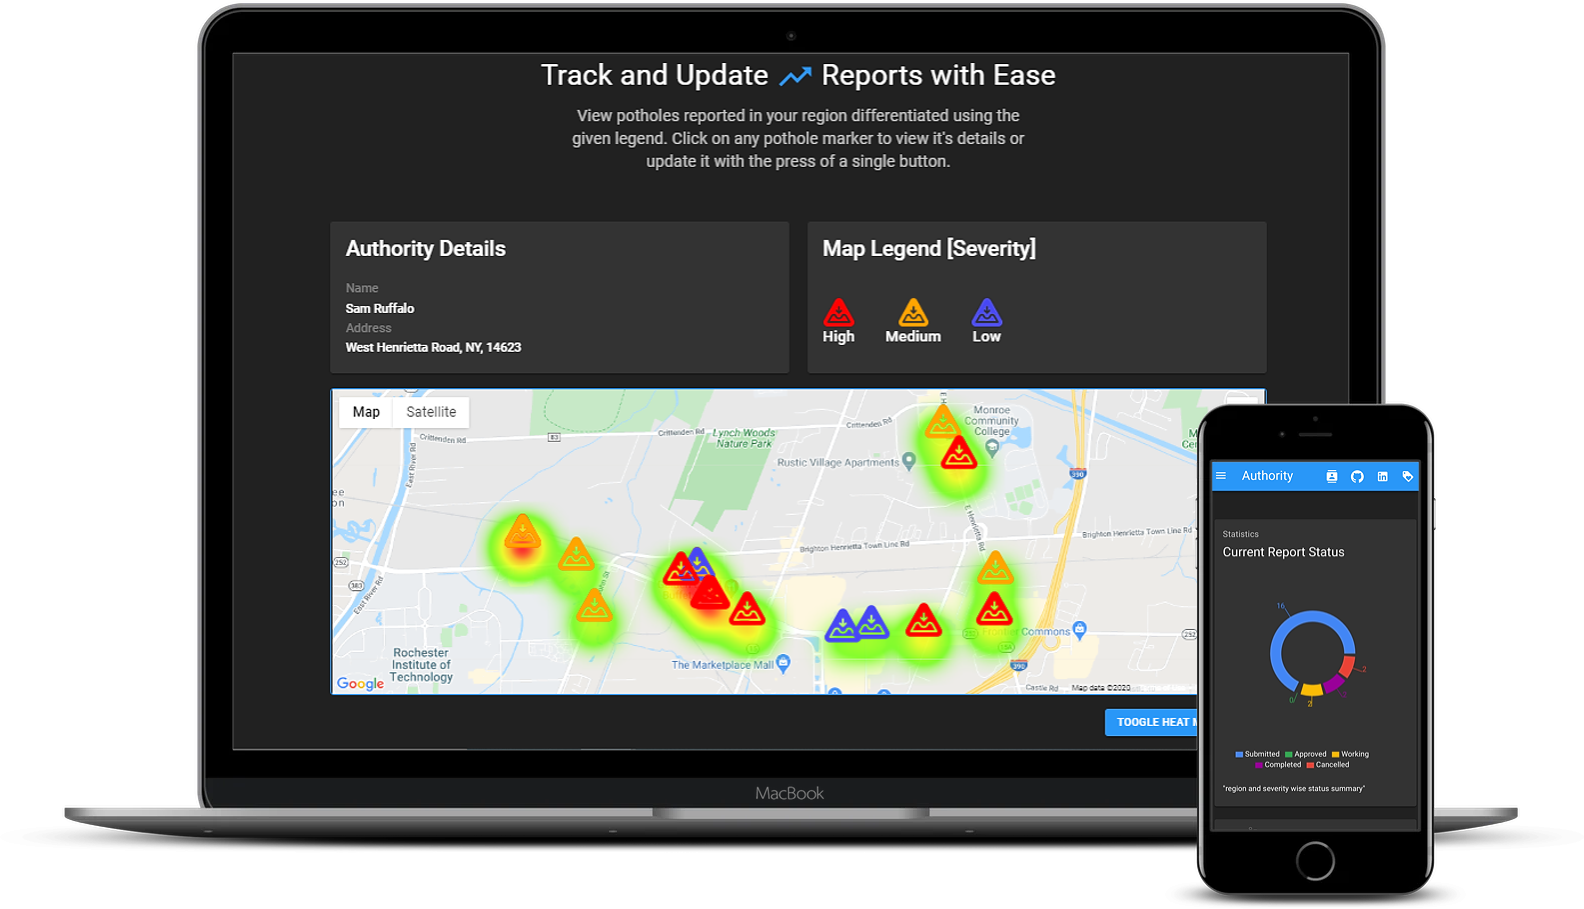
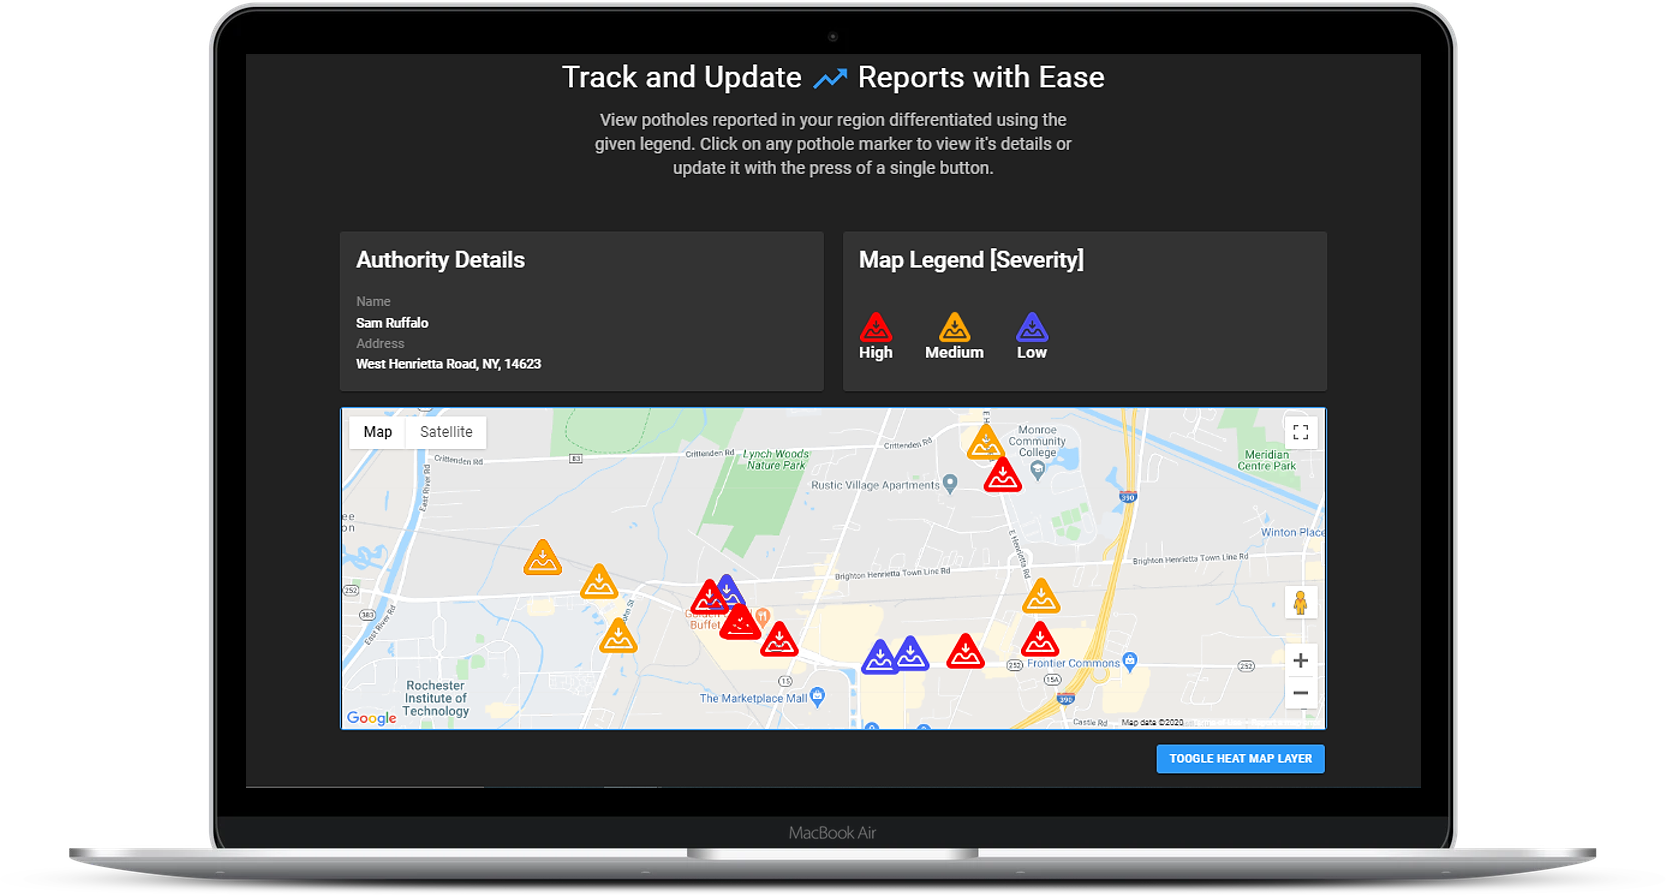
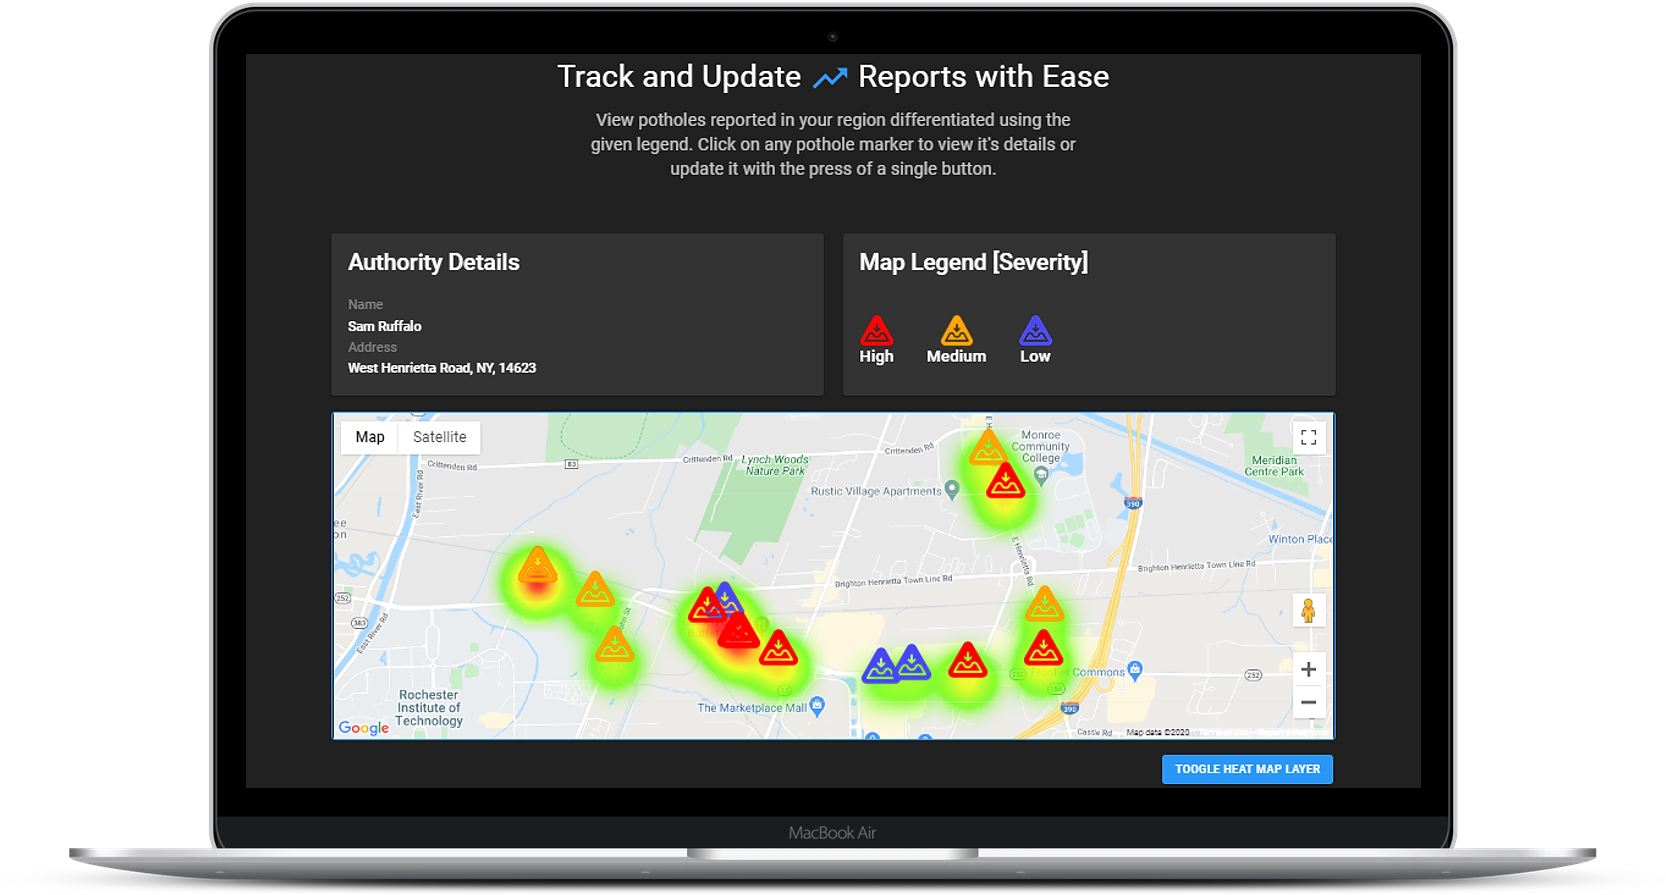
1. Here authotities can view potholes reported in their region through an interactive map view. Existing users who have at least one report created in their jurisdiction can manage the status of their report and add additional comments to it or reply on comments from users using this section of the app. A legend is displayed for helping understand the map better.
2. Custom markers for potholes with different status values ranging on severity are presented to the authority on the map. Authorities can click on any of the markers to view the information window for it. They can update the status and severity directly from this view after clicking the view button in the info window.
3. Also, there is a street view renderer for the users. Finally there is an option to toggle on and off a heat map layer which is weighted on the severity of potholes reported in the region.

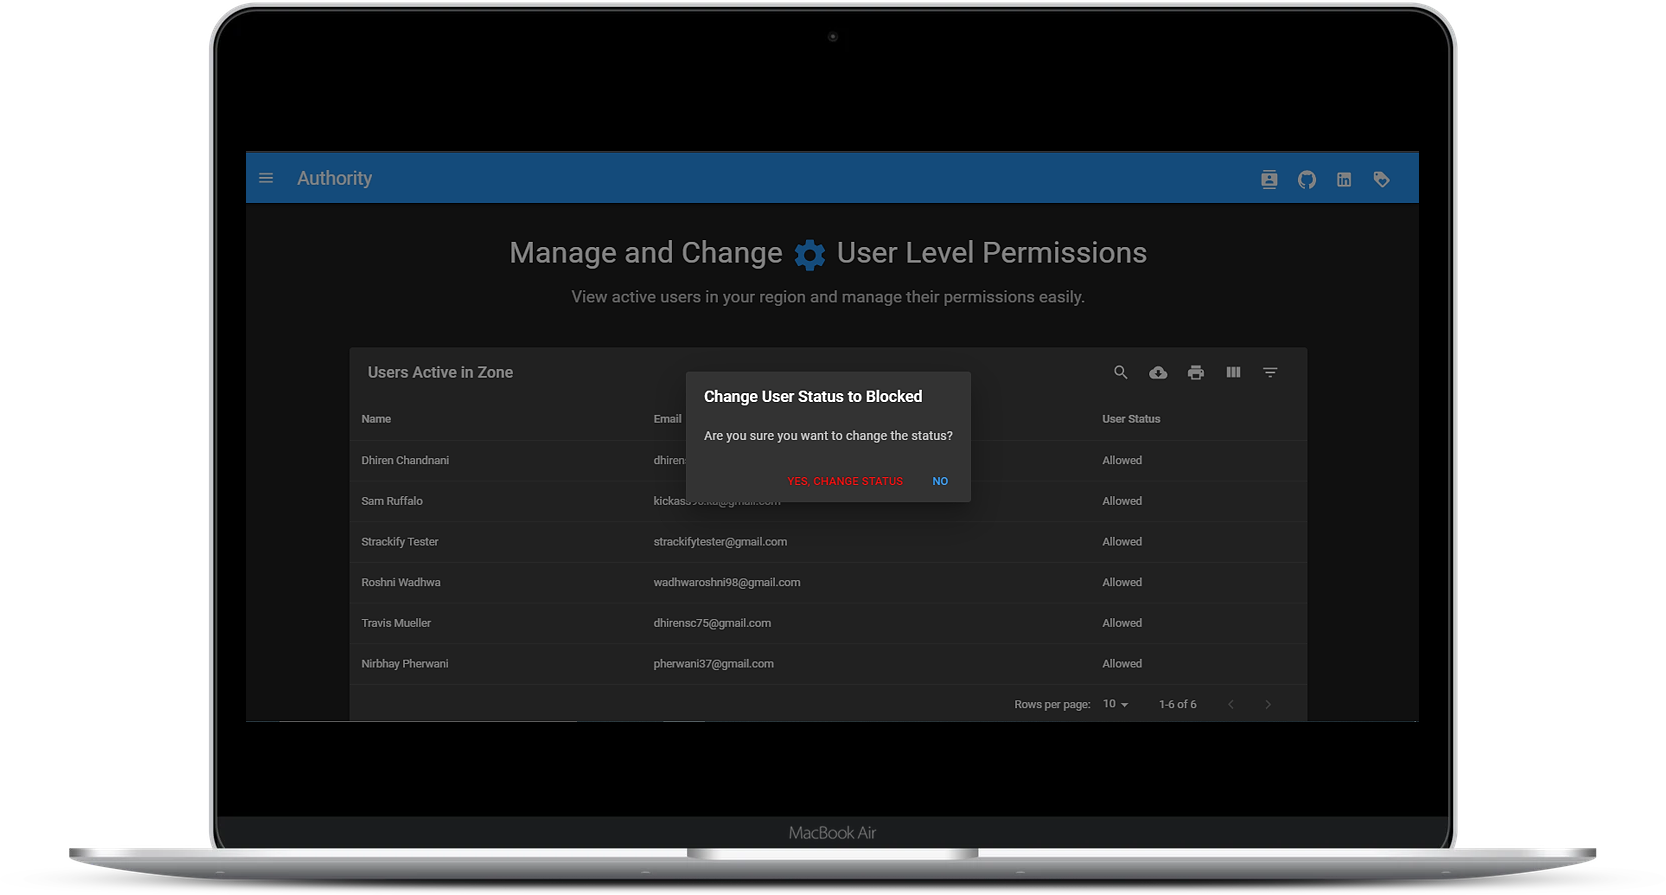
1. This screen presents the authority to manage all active users in their zone through a filterable data table. The data table contains options to filter, search, sort, select columns.
2. They can view a user's basic profile details. They can update a user's status to either blocked or allowed based on their activity too.
3. Users are sent out email notifications regarding updates in their status everytime an authority makes a change.

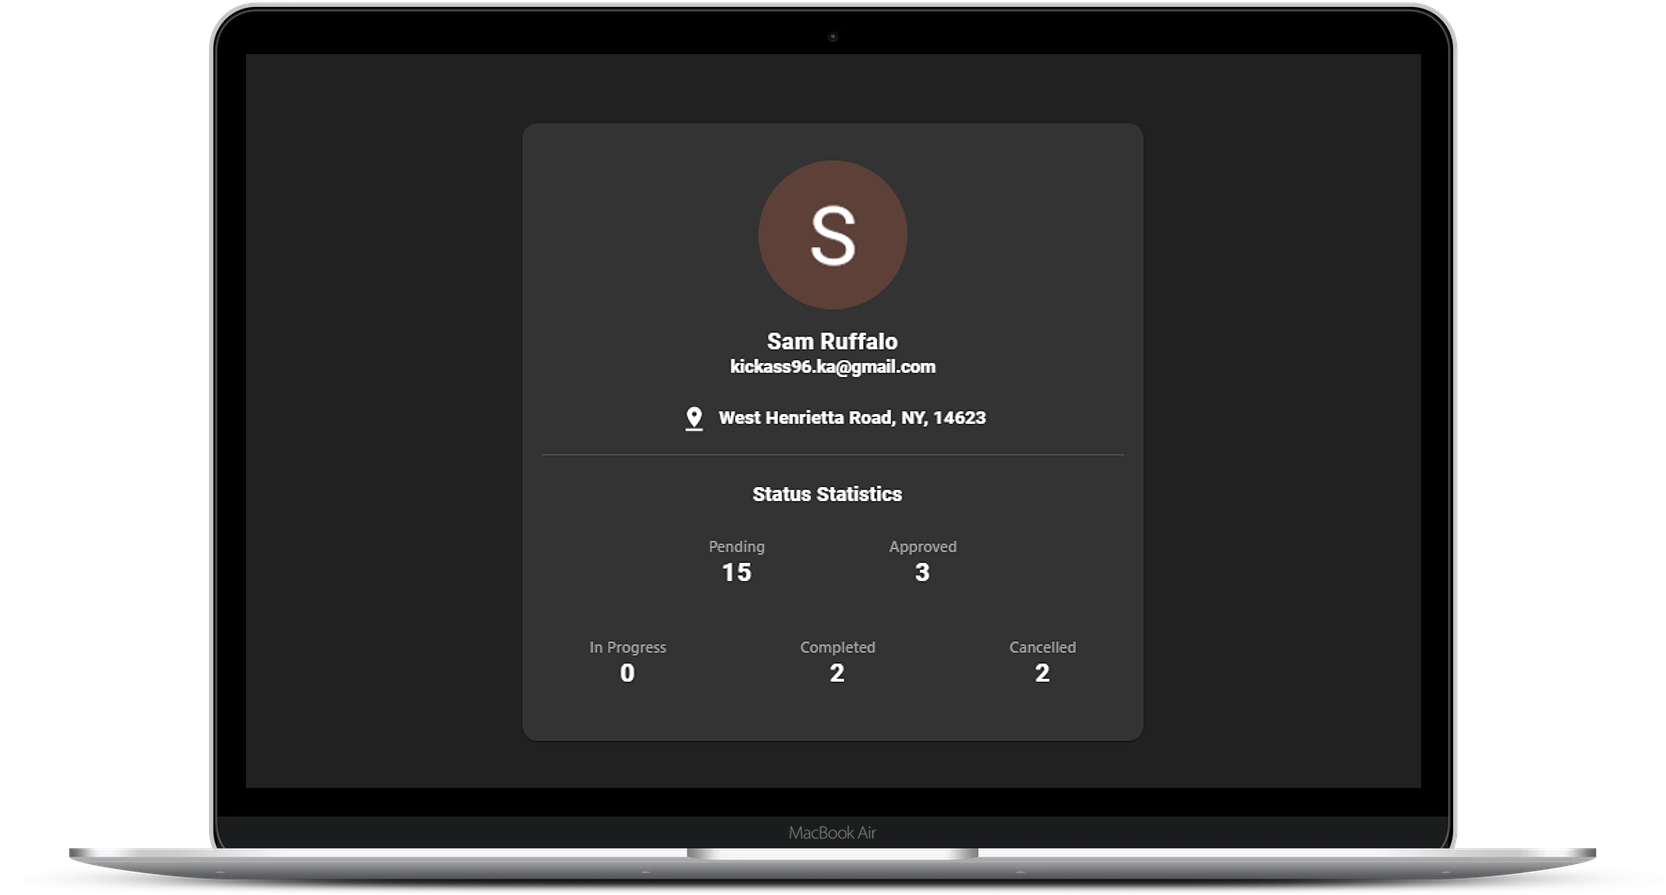
1. This screen contains the basic details (avatar, name, email address of the authority)
2. It also contains the address of the authority.
3. It is then followed by a counter for reports in the authority's zone with a status of either pending, in progress, approved, completed or cancelled.

The authority's application has a number of screens and visual interfaces associated. Here's a section showcasing a few snaps on different devices.
Here are some important URLs developers can use to learn more about the application
The server-side comprises of two main sections. The first being the deep learning model for the validation check. The second being the API for data exchange between the model built, the database, the datastore and the client applications.
1. The core idea behind Spothole was to develop a object detection based validation system that would perform checks on uploads by users thus reducing the effort level for the authorities and help in solving the issue quickly.
2. Also, as the system is independent of any medium to capture the area unlike previously mentioned approaches, more people can contribute towards the reporting segment.
3. All in all the validation check ensures near to no filtering of reports from the authority's end.

1. An entire endpoint suite has been made available for developers to use.
2. The suite consists of endpoints for interacting with the object detection model as well as with spothole / the consumer's local database, thus providing an easy to use mechansim to have communication between the model, the front-end applications and the relational database.
3. For a detailed documenation on the API please visit the developer's section for the core backend on this page.
1. This screen presents the authority to manage all active users in their zone through a filterable data table. The data table contains options to filter, search, sort, select columns.
2. They can view a user's basic profile details. They can update a user's status to either blocked or allowed based on their activity too.
3. Users are sent out email notifications regarding updates in their status everytime an authority makes a change.
1. This screen contains the basic details (avatar, name, email address of the authority)
2. It also contains the address of the authority.
3. It is then followed by a counter for reports in the authority's zone with a status of either pending, in progress, approved, completed or cancelled.
Here are some important URLs developers can use to learn more about the core backend functionality.
A number of technologies have been used to develop both the client applications and the core backend. Here are a few to name.


This project was started as part of the Capstone Project for my Master's in Information Sciences and Technologies at Rochester Institute of Technology, New York.
Capstone Committee
Dr. Charles Border
Prof. Edward Holden
Prof. Bryan French

To sign up as an authority may require special permissions. Please email contact.spothole@gmail.com